

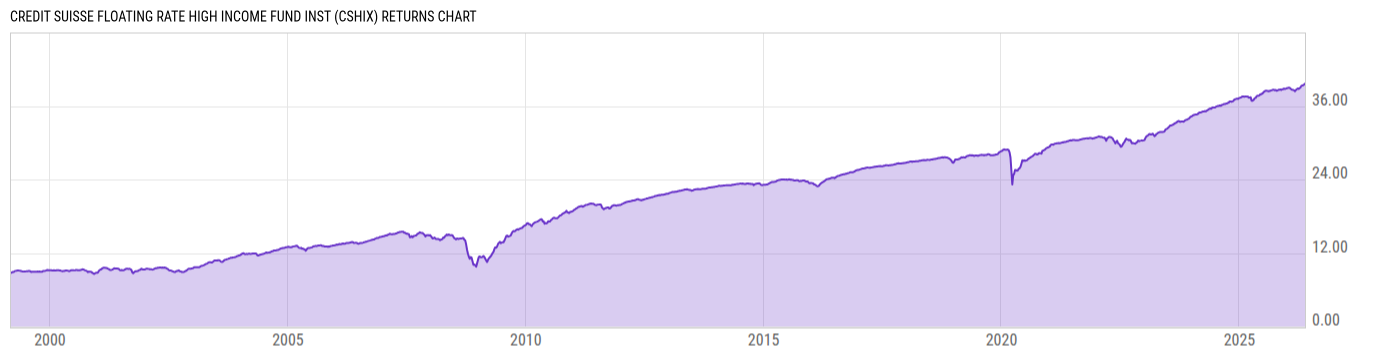
Credit Suisse Floating Rate High Income Fund Inst (CSHIX)
6.05
0.00 (0.00%)
USD |
Jun 09 2026
Returns Chart
Key Stats
| Net Expense Ratio | Total Assets Under Management | Weighted Average Dividend Yield | Turnover Ratio (Generic) |
|---|---|---|---|
| 0.70% | 1.477B | -- | 51.00% |
| 1 Year Fund Level Flows | 1 Year Total Returns (Daily) | Annualized Total Returns Since Inception (Daily) | Max Drawdown (Since Inception) |
| -327.85M | 4.58% |
Basic Info
| Investment Strategy | |
| The Fund seeks high current income and, secondarily, capital appreciation. The Fund invests primarily in a diversified portfolio of high risk fixed income securities, including convertible and non-convertible debt securities and preferred stock. The Fund may invest up to 30% of its assets in securities of non-US issuers. |
| General | |
| Security Type | Mutual Fund |
| Equity Style | -- |
| Broad Asset Class | Taxable Bond |
| Broad Category | Fixed Income |
| Global Peer Group | Loan Participation Funds |
| Peer Group | Loan Participation Funds |
| Global Macro | Loan Participation Funds |
| US Macro | General Domestic Taxable Fixed Income Funds |
| YCharts Categorization | -- |
| YCharts Benchmark | -- |
| Prospectus Objective | Loan Participation Funds |
| Fund Owner Firm Name | UBS Asset Management |
| Broad Asset Class Benchmark Index | |
| ^BBUSATR | 100.0% |
Net Fund Flows Versus Peer Group
1 Month
% Rank:
91
-120.38M
Peer Group Low
1.130B
Peer Group High
1 Year
% Rank:
74
-327.85M
-1.857B
Peer Group Low
6.524B
Peer Group High
3 Months
% Rank:
94
-902.22M
Peer Group Low
2.516B
Peer Group High
3 Years
% Rank:
83
-2.611B
Peer Group Low
21.94B
Peer Group High
6 Months
% Rank:
92
-1.596B
Peer Group Low
4.432B
Peer Group High
5 Years
% Rank:
91
-4.547B
Peer Group Low
24.56B
Peer Group High
YTD
% Rank:
92
-1.334B
Peer Group Low
3.795B
Peer Group High
10 Years
% Rank:
77
-10.87B
Peer Group Low
25.40B
Peer Group High
Date Unavailable
Risk
Performance Versus Peer Group
Annual Total Returns Versus Peers
As of June 10, 2026.
Asset Allocation
As of April 30, 2026.
| Type | % Net |
|---|---|
| Cash | 2.66% |
| Stock | 1.31% |
| Bond | 97.82% |
| Convertible | 0.00% |
| Preferred | 0.01% |
| Other | -1.81% |
Top 10 Holdings
| Name | % Weight | Price | % Change |
|---|---|---|---|
| State Street US Government Money Market Fund Prem | 5.42% | 1.00 | 0.00% |
|
Alloy Finco Ltd PIK FRN 06-Mar-2028
|
3.38% | -- | -- |
|
Ardonagh Group Ltd 15-FEB-2031 Term Loan B
|
0.96% | -- | -- |
|
Flynn Restaurant Group LP 28-JAN-2032 Term Loan B
|
0.91% | -- | -- |
|
UKG Inc [Ex- Ultimate Software Inc] 09-FEB-2031 Term Loan B
|
0.88% | -- | -- |
|
Zuffa LLC [Ex- Ultimate Fighting Championship] 21-NOV-2031 Term Loan B
|
0.86% | -- | -- |
|
RealPage Inc 22-APR-2028 Delay Draw Term Loan
|
0.85% | -- | -- |
|
White Cap Buyer LLC 13-OCT-2029 Term Loan B
|
0.80% | -- | -- |
|
Gloves Buyer Inc 22-MAY-2032 Delay Draw Term Loan
|
0.78% | -- | -- |
|
Nord Anglia Education Ltd 31-JAN-2032 Term Loan B
|
0.78% | -- | -- |
Fees & Availability
| Fees | |
| Actual 12B-1 Fee | -- |
| Actual Management Fee | 0.49% |
| Administration Fee | 290.1K% |
| Maximum Front Load | -- |
| Maximum Deferred Load | -- |
| Maximum Redemption Fee | 0.00% |
| General Availability | |
| Available for Insurance Product | No |
| Available for RRSP | No |
| Purchase Details | |
| Open to New Investors |
|
| Minimum Initial Investment | 250000.0 None |
| Minimum Subsequent Investment | 100000.0 None |
Basic Info
| Investment Strategy | |
| The Fund seeks high current income and, secondarily, capital appreciation. The Fund invests primarily in a diversified portfolio of high risk fixed income securities, including convertible and non-convertible debt securities and preferred stock. The Fund may invest up to 30% of its assets in securities of non-US issuers. |
| General | |
| Security Type | Mutual Fund |
| Equity Style | -- |
| Broad Asset Class | Taxable Bond |
| Broad Category | Fixed Income |
| Global Peer Group | Loan Participation Funds |
| Peer Group | Loan Participation Funds |
| Global Macro | Loan Participation Funds |
| US Macro | General Domestic Taxable Fixed Income Funds |
| YCharts Categorization | -- |
| YCharts Benchmark | -- |
| Prospectus Objective | Loan Participation Funds |
| Fund Owner Firm Name | UBS Asset Management |
| Broad Asset Class Benchmark Index | |
| ^BBUSATR | 100.0% |
Fundamentals
| General | |
| Distribution Yield | -- |
| Dividend Yield TTM (6-8-26) | 7.40% |
| 30-Day SEC Yield (5-31-26) | 6.86% |
| 7-Day SEC Yield | -- |
| Number of Holdings | 409 |
| Bond | |
| Yield to Maturity (4-30-26) | 7.57% |
| Effective Duration | -- |
| Average Coupon | 7.78% |
| Calculated Average Quality | 5.637 |
| Effective Maturity | 4.371 |
| Nominal Maturity | 4.384 |
| Number of Bond Holdings | 370 |
As of April 30, 2026
Fund Details
Top Portfolio Holders
| Name | % Weight |
|---|---|
| Portfolio A | 5.00% |
| Portfolio B | 3.50% |
| Portfolio C | 2.25% |
Excel Add-In Codes
| Name: =YCI("M:CSHIX", "name") |
| Broad Asset Class: =YCI("M:CSHIX", "broad_asset_class") |
| Broad Category: =YCI("M:CSHIX", "broad_category_group") |
| Prospectus Objective: =YCI("M:CSHIX", "prospectus_objective") |
| To find the codes for any of our securities and financial metrics, see our Complete Excel Reference. |