

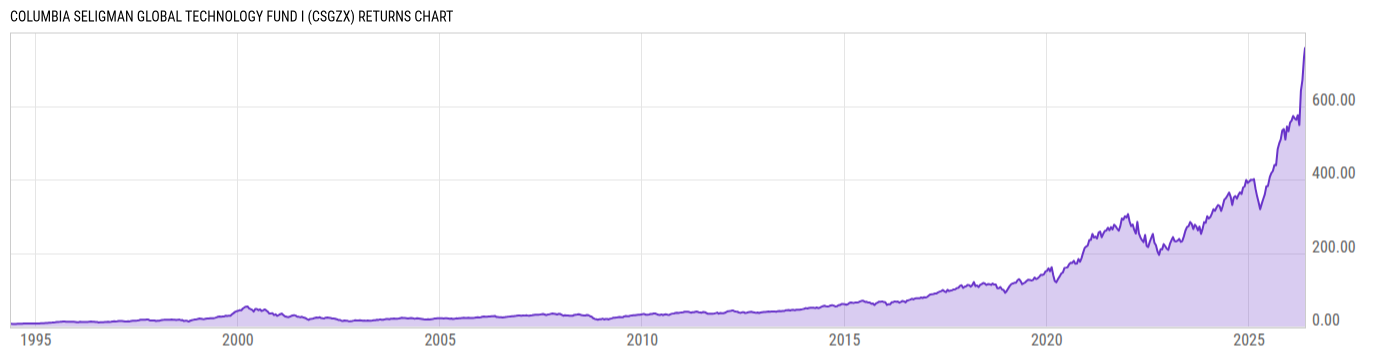
Columbia Seligman Global Technology Fund I (CSGZX)
139.71
-1.49
(-1.06%)
USD |
Jun 09 2026
Returns Chart
Key Stats
| Net Expense Ratio | Total Assets Under Management | Weighted Average Dividend Yield | Turnover Ratio (Generic) |
|---|---|---|---|
| 1.00% | 4.568B | 0.42% | 25.00% |
| 1 Year Fund Level Flows | 1 Year Total Returns (Daily) | Annualized Total Returns Since Inception (Daily) | Max Drawdown (Since Inception) |
| -167.32M | 100.1% |
Basic Info
| Investment Strategy | |
| The Fund seeks to provide shareholders with long-term capital appreciation. The Fund invests at least 80% of its net assets in equity securities of US & non-US companies with business operations in technology and technology-related industries, uses technology extensively to improve their business processes & applications. |
| General | |
| Security Type | Mutual Fund |
| Equity Style | Multi Cap Growth |
| Broad Asset Class | Sector Equity |
| Broad Category | Equity |
| Global Peer Group | Equity Sector Information Technology |
| Peer Group | Global Science/Technology Funds |
| Global Macro | Equity Industry Sector |
| US Macro | World Sector Equity Funds |
| YCharts Categorization | -- |
| YCharts Benchmark | -- |
| Prospectus Objective | Global Science/Technology Funds |
| Fund Owner Firm Name | Columbia Threadneedle Investments |
| Broad Asset Class Benchmark Index | |
| ^MSWNTR | 100.0% |
Net Fund Flows Versus Peer Group
1 Month
% Rank:
25
-151.07M
Peer Group Low
2.117B
Peer Group High
1 Year
% Rank:
87
-167.32M
-1.019B
Peer Group Low
9.085B
Peer Group High
3 Months
% Rank:
27
-328.72M
Peer Group Low
2.658B
Peer Group High
3 Years
% Rank:
84
-1.707B
Peer Group Low
10.80B
Peer Group High
6 Months
% Rank:
81
-744.53M
Peer Group Low
3.490B
Peer Group High
5 Years
% Rank:
78
-3.665B
Peer Group Low
10.80B
Peer Group High
YTD
% Rank:
63
-491.87M
Peer Group Low
3.238B
Peer Group High
10 Years
% Rank:
92
-3.052B
Peer Group Low
11.78B
Peer Group High
Date Unavailable
Risk
Performance Versus Peer Group
Annual Total Returns Versus Peers
As of June 10, 2026.
Asset Allocation
As of April 30, 2026.
| Type | % Net |
|---|---|
| Cash | 2.31% |
| Stock | 98.61% |
| Bond | 0.00% |
| Convertible | 0.00% |
| Preferred | 0.00% |
| Other | -0.91% |
Top 10 Holdings
| Name | % Weight | Price | % Change |
|---|---|---|---|
| Bloom Energy Corp. | 13.57% | 251.72 | -3.04% |
| Lam Research Corp. | 6.80% | 330.86 | 1.13% |
| Marvell Technology, Inc. | 5.48% | 265.09 | -0.67% |
| Broadcom Inc. | 4.78% | 378.41 | -3.51% |
| NVIDIA Corp. | 4.73% | 206.34 | -0.89% |
| Alphabet, Inc. | 4.31% | 363.54 | -0.20% |
| Western Digital Corp. | 3.95% | 500.58 | -3.31% |
| Applied Materials, Inc. | 3.55% | 510.00 | 2.16% |
| Apple, Inc. | 2.82% | 288.99 | -0.54% |
| Microsoft Corp. | 2.80% | 399.29 | -1.02% |
Fees & Availability
| Fees | |
| Actual 12B-1 Fee | -- |
| Actual Management Fee | 0.88% |
| Administration Fee | -- |
| Maximum Front Load | -- |
| Maximum Deferred Load | -- |
| Maximum Redemption Fee | -- |
| General Availability | |
| Available for Insurance Product | No |
| Available for RRSP | No |
| Purchase Details | |
| Open to New Investors |
|
| Minimum Initial Investment | 2000.00 None |
| Minimum Subsequent Investment | 0.00 None |
Basic Info
| Investment Strategy | |
| The Fund seeks to provide shareholders with long-term capital appreciation. The Fund invests at least 80% of its net assets in equity securities of US & non-US companies with business operations in technology and technology-related industries, uses technology extensively to improve their business processes & applications. |
| General | |
| Security Type | Mutual Fund |
| Equity Style | Multi Cap Growth |
| Broad Asset Class | Sector Equity |
| Broad Category | Equity |
| Global Peer Group | Equity Sector Information Technology |
| Peer Group | Global Science/Technology Funds |
| Global Macro | Equity Industry Sector |
| US Macro | World Sector Equity Funds |
| YCharts Categorization | -- |
| YCharts Benchmark | -- |
| Prospectus Objective | Global Science/Technology Funds |
| Fund Owner Firm Name | Columbia Threadneedle Investments |
| Broad Asset Class Benchmark Index | |
| ^MSWNTR | 100.0% |
Fundamentals
| General | |
| Distribution Yield | -- |
| Dividend Yield TTM (6-8-26) | 0.20% |
| 30-Day SEC Yield | -- |
| 7-Day SEC Yield | -- |
| Number of Holdings | 80 |
| Stock | |
| Weighted Average PE Ratio | 38.06 |
| Weighted Average Price to Sales Ratio | 14.78 |
| Weighted Average Price to Book Ratio | 15.18 |
| Weighted Median ROE | 41.92% |
| Weighted Median ROA | 17.40% |
| ROI (TTM) | 23.46% |
| Return on Investment (TTM) | 23.46% |
| Earning Yield | 0.0363 |
| LT Debt / Shareholders Equity | 1.323 |
| Number of Equity Holdings | 66 |
As of April 30, 2026
Growth Metrics
| EPS Growth (1Y) | 22.29% |
| EPS Growth (3Y) | 24.05% |
| EPS Growth (5Y) | 27.61% |
| Sales Growth (1Y) | 22.08% |
| Sales Growth (3Y) | 13.28% |
| Sales Growth (5Y) | 15.97% |
| Sales per Share Growth (1Y) | 21.42% |
| Sales per Share Growth (3Y) | 12.23% |
| Operating Cash Flow - Growth Rate (3Y) | 24.60% |
As of April 30, 2026
Fund Details
| Key Dates | |
| Inception Date | 5/23/1994 |
| Last Annual Report Date | 10/31/2025 |
| Last Prospectus Date | 3/1/2026 |
| Share Classes | |
| CGTYX | Inst |
| CSGAX | S |
| SGTRX | Retirement |
| SGTTX | Inst |
| SHGTX | A |
| SHTCX | C |
| Attributes | |
| Index Fund | -- |
| Inverse Fund | No |
| Leveraged Fund | -- |
| Fund of Funds | No |
| Currency Hedged Fund | -- |
| Socially Responsible Fund | No |
Top Portfolio Holders
| Name | % Weight |
|---|---|
| Portfolio A | 5.00% |
| Portfolio B | 3.50% |
| Portfolio C | 2.25% |
Excel Add-In Codes
| Name: =YCI("M:CSGZX", "name") |
| Broad Asset Class: =YCI("M:CSGZX", "broad_asset_class") |
| Broad Category: =YCI("M:CSGZX", "broad_category_group") |
| Prospectus Objective: =YCI("M:CSGZX", "prospectus_objective") |
| To find the codes for any of our securities and financial metrics, see our Complete Excel Reference. |