

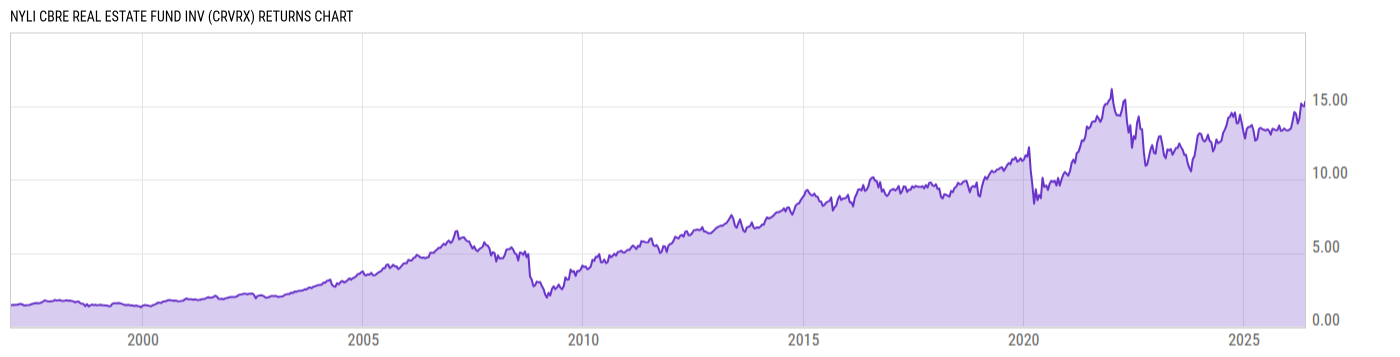
NYLI CBRE Real Estate Fund Inv (CRVRX)
9.03
+0.02
(+0.22%)
USD |
May 22 2026
Returns Chart
Key Stats
| Net Expense Ratio | Total Assets Under Management | Weighted Average Dividend Yield | Turnover Ratio (Generic) |
|---|---|---|---|
| 1.33% | 224.31M | 3.58% | 98.00% |
| 1 Year Fund Level Flows | 1 Year Total Returns (Daily) | Annualized Total Returns Since Inception (Daily) | Max Drawdown (Since Inception) |
| -40.64M | 16.90% |
Basic Info
| Investment Strategy | |
| The Fund seeks total return. The Fund invests at least 80% of its assets in common and preferred stocks of US real estate investment trusts and other real estate companies, also the Fund is non-diversified, which means it may invest a greater percentage of its assets in a smaller number of issuers than a diversified fund. |
| General | |
| Security Type | Mutual Fund |
| Equity Style | Multi Cap Core |
| Broad Asset Class | Sector Equity |
| Broad Category | Equity |
| Global Peer Group | Equity Sector Real Estate US |
| Peer Group | Real Estate Funds |
| Global Macro | Equity Real Estate |
| US Macro | Sector Equity Funds |
| YCharts Categorization | -- |
| YCharts Benchmark | -- |
| Prospectus Objective | Real Estate Funds |
| Fund Owner Firm Name | New York Life Investments |
| Broad Asset Class Benchmark Index | |
| ^MSWNTR | 100.0% |
Net Fund Flows Versus Peer Group
1 Month
% Rank:
54
-1.958B
Peer Group Low
250.50M
Peer Group High
1 Year
% Rank:
63
-40.64M
-1.347B
Peer Group Low
929.48M
Peer Group High
3 Months
% Rank:
59
-1.898B
Peer Group Low
306.86M
Peer Group High
3 Years
% Rank:
65
-6.202B
Peer Group Low
2.527B
Peer Group High
6 Months
% Rank:
64
-1.720B
Peer Group Low
599.29M
Peer Group High
5 Years
% Rank:
60
-5.705B
Peer Group Low
3.751B
Peer Group High
YTD
% Rank:
65
-1.797B
Peer Group Low
318.65M
Peer Group High
10 Years
% Rank:
84
-7.424B
Peer Group Low
6.609B
Peer Group High
Date Unavailable
Risk
Performance Versus Peer Group
Annual Total Returns Versus Peers
As of May 24, 2026.
Asset Allocation
As of November 30, 2025.
| Type | % Net |
|---|---|
| Cash | 0.00% |
| Stock | 99.64% |
| Bond | 0.00% |
| Convertible | 0.00% |
| Preferred | 0.00% |
| Other | 0.36% |
Top 10 Holdings
| Name | % Weight | Price | % Change |
|---|---|---|---|
| Welltower, Inc. | 12.70% | 216.17 | 0.07% |
| Equinix, Inc. | 10.60% | 1079.79 | 0.13% |
| American Tower Corp. | 7.97% | 183.85 | 0.04% |
| Prologis, Inc. | 6.93% | 145.90 | 0.88% |
| Simon Property Group, Inc. | 5.35% | 204.41 | -0.24% |
| Brixmor Property Group, Inc. | 3.15% | 30.84 | -0.06% |
| EastGroup Properties, Inc. | 3.10% | 205.16 | -0.01% |
| Iron Mountain, Inc. | 3.08% | 126.46 | -0.68% |
| Realty Income Corp. | 2.72% | 62.02 | -0.34% |
| First Industrial Realty Trust, Inc. | 2.68% | 63.28 | 1.35% |
Fees & Availability
| Fees | |
| Actual 12B-1 Fee | 0.25% |
| Actual Management Fee | 0.75% |
| Administration Fee | -- |
| Maximum Front Load | 5.00% |
| Maximum Deferred Load | -- |
| Maximum Redemption Fee | -- |
| General Availability | |
| Available for Insurance Product | No |
| Available for RRSP | No |
| Purchase Details | |
| Open to New Investors |
|
| Minimum Initial Investment | 1000.00 None |
| Minimum Subsequent Investment | 50.00 None |
Basic Info
| Investment Strategy | |
| The Fund seeks total return. The Fund invests at least 80% of its assets in common and preferred stocks of US real estate investment trusts and other real estate companies, also the Fund is non-diversified, which means it may invest a greater percentage of its assets in a smaller number of issuers than a diversified fund. |
| General | |
| Security Type | Mutual Fund |
| Equity Style | Multi Cap Core |
| Broad Asset Class | Sector Equity |
| Broad Category | Equity |
| Global Peer Group | Equity Sector Real Estate US |
| Peer Group | Real Estate Funds |
| Global Macro | Equity Real Estate |
| US Macro | Sector Equity Funds |
| YCharts Categorization | -- |
| YCharts Benchmark | -- |
| Prospectus Objective | Real Estate Funds |
| Fund Owner Firm Name | New York Life Investments |
| Broad Asset Class Benchmark Index | |
| ^MSWNTR | 100.0% |
Fundamentals
| General | |
| Distribution Yield | -- |
| Dividend Yield TTM (5-21-26) | 2.47% |
| 30-Day SEC Yield (4-30-26) | 2.14% |
| 7-Day SEC Yield | -- |
| Number of Holdings | 44 |
| Stock | |
| Weighted Average PE Ratio | 38.84 |
| Weighted Average Price to Sales Ratio | 9.050 |
| Weighted Average Price to Book Ratio | 5.813 |
| Weighted Median ROE | 13.43% |
| Weighted Median ROA | 3.65% |
| ROI (TTM) | 11.64% |
| Return on Investment (TTM) | 11.64% |
| Earning Yield | 0.0325 |
| LT Debt / Shareholders Equity | 1.416 |
| Number of Equity Holdings | 41 |
As of November 30, 2025
Growth Metrics
| EPS Growth (1Y) | 18.54% |
| EPS Growth (3Y) | 12.03% |
| EPS Growth (5Y) | 2.58% |
| Sales Growth (1Y) | 8.66% |
| Sales Growth (3Y) | 12.74% |
| Sales Growth (5Y) | 10.27% |
| Sales per Share Growth (1Y) | 2.62% |
| Sales per Share Growth (3Y) | 6.49% |
| Operating Cash Flow - Growth Rate (3Y) | 14.86% |
As of November 30, 2025
Fund Details
Top Portfolio Holders
| Name | % Weight |
|---|---|
| Portfolio A | 5.00% |
| Portfolio B | 3.50% |
| Portfolio C | 2.25% |
Excel Add-In Codes
| Name: =YCI("M:CRVRX", "name") |
| Broad Asset Class: =YCI("M:CRVRX", "broad_asset_class") |
| Broad Category: =YCI("M:CRVRX", "broad_category_group") |
| Prospectus Objective: =YCI("M:CRVRX", "prospectus_objective") |
| To find the codes for any of our securities and financial metrics, see our Complete Excel Reference. |