

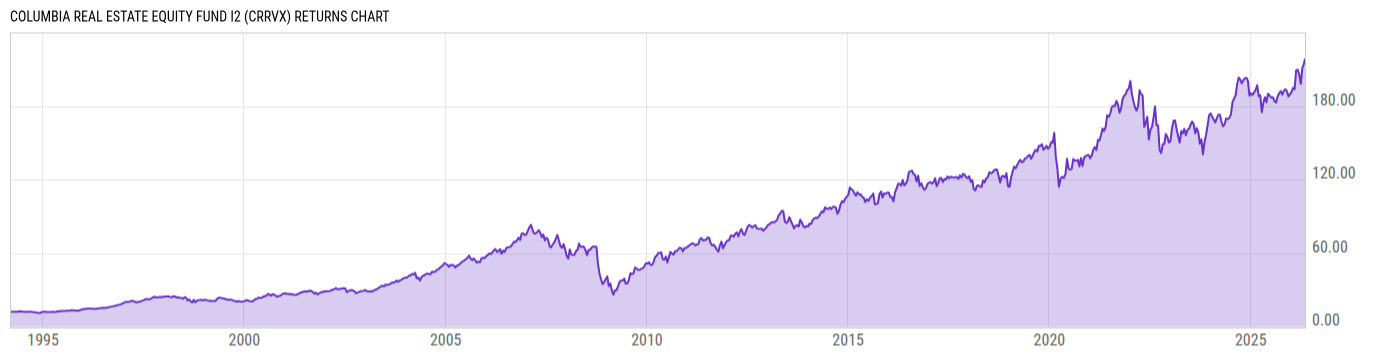
Columbia Real Estate Equity Fund I2 (CRRVX)
10.33
0.00 (0.00%)
USD |
Jun 03 2026
Returns Chart
Key Stats
| Net Expense Ratio | Total Assets Under Management | Weighted Average Dividend Yield | Turnover Ratio (Generic) |
|---|---|---|---|
| 0.90% | 127.96M | 3.15% | 43.00% |
| 1 Year Fund Level Flows | 1 Year Total Returns (Daily) | Annualized Total Returns Since Inception (Daily) | Max Drawdown (Since Inception) |
| -47.79M | 12.89% |
Basic Info
| Investment Strategy | |
| The Fund seeks capital appreciation and above-average income by investing, under normal market conditions, at least 80% of its net assets in the stocks of companies principally engaged in the real estate industry, including real estate investment trusts. Fund will concentrate its investments in the real estate industry. |
| General | |
| Security Type | Mutual Fund |
| Equity Style | Mid Cap Core |
| Broad Asset Class | Sector Equity |
| Broad Category | Equity |
| Global Peer Group | Equity Sector Real Estate US |
| Peer Group | Real Estate Funds |
| Global Macro | Equity Real Estate |
| US Macro | Sector Equity Funds |
| YCharts Categorization | -- |
| YCharts Benchmark | -- |
| Prospectus Objective | Real Estate Funds |
| Fund Owner Firm Name | Columbia Threadneedle Investments |
| Broad Asset Class Benchmark Index | |
| ^MSWNTR | 100.0% |
Net Fund Flows Versus Peer Group
1 Month
% Rank:
65
-1.958B
Peer Group Low
833.28M
Peer Group High
1 Year
% Rank:
67
-47.79M
-1.347B
Peer Group Low
1.065B
Peer Group High
3 Months
% Rank:
67
-1.898B
Peer Group Low
668.26M
Peer Group High
3 Years
% Rank:
60
-5.204B
Peer Group Low
2.527B
Peer Group High
6 Months
% Rank:
61
-1.720B
Peer Group Low
560.20M
Peer Group High
5 Years
% Rank:
58
-7.873B
Peer Group Low
3.884B
Peer Group High
YTD
% Rank:
65
-1.797B
Peer Group Low
318.65M
Peer Group High
10 Years
% Rank:
63
-7.585B
Peer Group Low
6.610B
Peer Group High
Date Unavailable
Risk
Performance Versus Peer Group
Annual Total Returns Versus Peers
As of June 04, 2026.
Asset Allocation
As of April 30, 2026.
| Type | % Net |
|---|---|
| Cash | 2.51% |
| Stock | 97.16% |
| Bond | 0.00% |
| Convertible | 0.00% |
| Preferred | 0.00% |
| Other | 0.33% |
Top 10 Holdings
| Name | % Weight | Price | % Change |
|---|---|---|---|
| Welltower, Inc. | 12.13% | 200.82 | 0.62% |
| Prologis, Inc. | 9.95% | 143.79 | 1.39% |
| Equinix, Inc. | 9.55% | 1062.08 | -1.39% |
| Simon Property Group, Inc. | 4.28% | 205.74 | 1.08% |
| Digital Realty Trust, Inc. | 3.76% | 182.00 | -0.82% |
| Equity Residential | 3.40% | 67.42 | 1.94% |
| Ventas, Inc. | 3.02% | 79.56 | 0.66% |
| Iron Mountain, Inc. | 2.83% | 126.09 | -1.45% |
| Realty Income Corp. | 2.72% | 60.38 | 1.11% |
| Public Storage | 2.64% | 307.02 | 1.67% |
Fees & Availability
| Fees | |
| Actual 12B-1 Fee | -- |
| Actual Management Fee | 0.74% |
| Administration Fee | -- |
| Maximum Front Load | -- |
| Maximum Deferred Load | -- |
| Maximum Redemption Fee | -- |
| General Availability | |
| Available for Insurance Product | No |
| Available for RRSP | No |
| Purchase Details | |
| Open to New Investors |
|
| Minimum Initial Investment | 0.00 None |
| Minimum Subsequent Investment | 0.00 None |
Basic Info
| Investment Strategy | |
| The Fund seeks capital appreciation and above-average income by investing, under normal market conditions, at least 80% of its net assets in the stocks of companies principally engaged in the real estate industry, including real estate investment trusts. Fund will concentrate its investments in the real estate industry. |
| General | |
| Security Type | Mutual Fund |
| Equity Style | Mid Cap Core |
| Broad Asset Class | Sector Equity |
| Broad Category | Equity |
| Global Peer Group | Equity Sector Real Estate US |
| Peer Group | Real Estate Funds |
| Global Macro | Equity Real Estate |
| US Macro | Sector Equity Funds |
| YCharts Categorization | -- |
| YCharts Benchmark | -- |
| Prospectus Objective | Real Estate Funds |
| Fund Owner Firm Name | Columbia Threadneedle Investments |
| Broad Asset Class Benchmark Index | |
| ^MSWNTR | 100.0% |
Fundamentals
| General | |
| Distribution Yield | -- |
| Dividend Yield TTM (6-2-26) | 0.66% |
| 30-Day SEC Yield (7-31-11) | 2.18% |
| 7-Day SEC Yield | -- |
| Number of Holdings | 82 |
| Stock | |
| Weighted Average PE Ratio | 38.62 |
| Weighted Average Price to Sales Ratio | 9.808 |
| Weighted Average Price to Book Ratio | 4.094 |
| Weighted Median ROE | 12.16% |
| Weighted Median ROA | 3.70% |
| ROI (TTM) | 11.23% |
| Return on Investment (TTM) | 11.23% |
| Earning Yield | 0.0327 |
| LT Debt / Shareholders Equity | 1.006 |
| Number of Equity Holdings | 77 |
As of April 30, 2026
Growth Metrics
| EPS Growth (1Y) | 23.69% |
| EPS Growth (3Y) | 11.88% |
| EPS Growth (5Y) | 6.83% |
| Sales Growth (1Y) | 11.86% |
| Sales Growth (3Y) | 11.05% |
| Sales Growth (5Y) | 12.47% |
| Sales per Share Growth (1Y) | 7.34% |
| Sales per Share Growth (3Y) | 5.58% |
| Operating Cash Flow - Growth Rate (3Y) | 11.11% |
As of April 30, 2026
Fund Details
Top Portfolio Holders
| Name | % Weight |
|---|---|
| Portfolio A | 5.00% |
| Portfolio B | 3.50% |
| Portfolio C | 2.25% |
Excel Add-In Codes
| Name: =YCI("M:CRRVX", "name") |
| Broad Asset Class: =YCI("M:CRRVX", "broad_asset_class") |
| Broad Category: =YCI("M:CRRVX", "broad_category_group") |
| Prospectus Objective: =YCI("M:CRRVX", "prospectus_objective") |
| To find the codes for any of our securities and financial metrics, see our Complete Excel Reference. |