

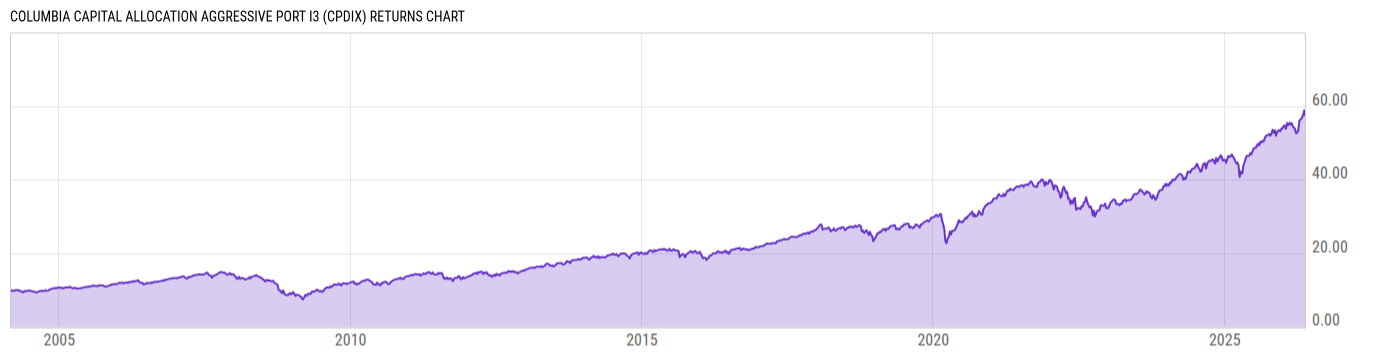
Columbia Capital Allocation Aggressive Port I3 (CPDIX)
14.61
0.00 (0.00%)
USD |
Jun 09 2026
Returns Chart
Key Stats
| Net Expense Ratio | Total Assets Under Management | Weighted Average Dividend Yield | Turnover Ratio (Generic) |
|---|---|---|---|
| 0.07% | 1.452B | -- | 19.00% |
| 1 Year Fund Level Flows | 1 Year Total Returns (Daily) | Annualized Total Returns Since Inception (Daily) | Max Drawdown (Since Inception) |
| -129.35M | 23.79% |
Basic Info
| Investment Strategy | |
| The Fund seeks the highest level of total return that is consistent with an aggressive level of risk. The Fund invests primarily in equity funds (75-85%) and also invests a small amount in fixed income funds (15-25%). |
| General | |
| Security Type | Mutual Fund |
| Equity Style | -- |
| Broad Asset Class | Allocation |
| Broad Category | Allocation |
| Global Peer Group | Mixed Asset USD Aggressive |
| Peer Group | Mixed-Asset Target Alloc Growth Funds |
| Global Macro | Mixed Asset HC Aggressive |
| US Macro | Mixed-Assets Target Allocation Funds |
| YCharts Categorization | -- |
| YCharts Benchmark | -- |
| Prospectus Objective | Growth Funds |
| Fund Owner Firm Name | Columbia Threadneedle Investments |
| Broad Asset Class Benchmark Index | |
| ^SPXTR | 100.0% |
Net Fund Flows Versus Peer Group
1 Month
% Rank:
59
-859.80M
Peer Group Low
327.50M
Peer Group High
1 Year
% Rank:
58
-129.35M
-13.50B
Peer Group Low
3.669B
Peer Group High
3 Months
% Rank:
58
-5.251B
Peer Group Low
893.21M
Peer Group High
3 Years
% Rank:
63
-27.78B
Peer Group Low
5.767B
Peer Group High
6 Months
% Rank:
60
-9.264B
Peer Group Low
2.137B
Peer Group High
5 Years
% Rank:
64
-39.16B
Peer Group Low
5.767B
Peer Group High
YTD
% Rank:
59
-7.441B
Peer Group Low
1.845B
Peer Group High
10 Years
% Rank:
66
-59.83B
Peer Group Low
10.34B
Peer Group High
Date Unavailable
Risk
Performance Versus Peer Group
Annual Total Returns Versus Peers
As of June 10, 2026.
Asset Allocation
As of April 30, 2026.
| Type | % Net |
|---|---|
| Cash | 2.98% |
| Stock | 36.49% |
| Bond | 3.34% |
| Convertible | 0.00% |
| Preferred | 0.22% |
| Other | 56.97% |
Top 10 Holdings
| Name | % Weight | Price | % Change |
|---|---|---|---|
| Columbia Contrarian Core Fund I3 | 15.31% | 42.77 | -0.16% |
|
COLUMBIA CORNERSTONE EQUITY CL I3 MF
|
14.69% | -- | -- |
|
COLUMBIA CORNERSTONE CL I3 MF
|
13.89% | -- | -- |
| Columbia Overseas Core Fund Institutional 3 | 13.17% | 13.15 | -0.15% |
|
CLMBA INTRINSIC VALUE CL I3 MF
|
13.02% | -- | -- |
| Columbia Research Enhanced Emerging Economies ETF | 4.02% | 34.73 | 0.04% |
|
COLUMBIA BOND CL I3 MF
|
3.88% | -- | -- |
|
CLMBA SELECT CORPORATE CL I3 MF
|
3.39% | -- | -- |
| Columbia Emerging Markets Fund I3 | 3.30% | 21.59 | 0.84% |
|
COLUMBIA QLTY INCM CL I3 MF
|
3.26% | -- | -- |
Fees & Availability
| Fees | |
| Actual 12B-1 Fee | -- |
| Actual Management Fee | 0.03% |
| Administration Fee | -- |
| Maximum Front Load | -- |
| Maximum Deferred Load | -- |
| Maximum Redemption Fee | -- |
| General Availability | |
| Available for Insurance Product | No |
| Available for RRSP | No |
| Purchase Details | |
| Open to New Investors |
|
| Minimum Initial Investment | 0.00 None |
| Minimum Subsequent Investment | 0.00 None |
Basic Info
| Investment Strategy | |
| The Fund seeks the highest level of total return that is consistent with an aggressive level of risk. The Fund invests primarily in equity funds (75-85%) and also invests a small amount in fixed income funds (15-25%). |
| General | |
| Security Type | Mutual Fund |
| Equity Style | -- |
| Broad Asset Class | Allocation |
| Broad Category | Allocation |
| Global Peer Group | Mixed Asset USD Aggressive |
| Peer Group | Mixed-Asset Target Alloc Growth Funds |
| Global Macro | Mixed Asset HC Aggressive |
| US Macro | Mixed-Assets Target Allocation Funds |
| YCharts Categorization | -- |
| YCharts Benchmark | -- |
| Prospectus Objective | Growth Funds |
| Fund Owner Firm Name | Columbia Threadneedle Investments |
| Broad Asset Class Benchmark Index | |
| ^SPXTR | 100.0% |
Fundamentals
| General | |
| Distribution Yield | -- |
| Dividend Yield TTM (6-8-26) | 1.83% |
| 30-Day SEC Yield | -- |
| 7-Day SEC Yield | -- |
| Number of Holdings | 18 |
Top Portfolio Holders
| Name | % Weight |
|---|---|
| Portfolio A | 5.00% |
| Portfolio B | 3.50% |
| Portfolio C | 2.25% |
Excel Add-In Codes
| Name: =YCI("M:CPDIX", "name") |
| Broad Asset Class: =YCI("M:CPDIX", "broad_asset_class") |
| Broad Category: =YCI("M:CPDIX", "broad_category_group") |
| Prospectus Objective: =YCI("M:CPDIX", "prospectus_objective") |
| To find the codes for any of our securities and financial metrics, see our Complete Excel Reference. |