

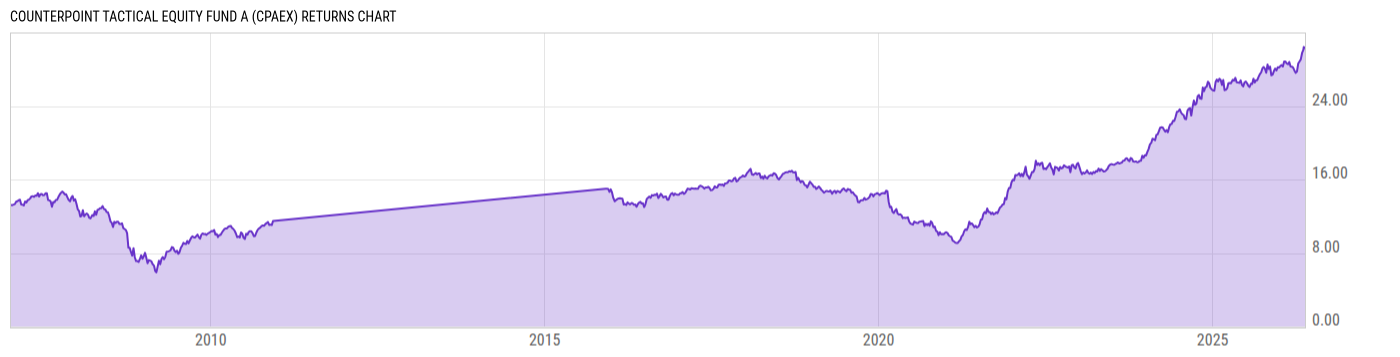
Counterpoint Tactical Equity Fund A (CPAEX)
24.53
-0.02
(-0.08%)
USD |
Jun 09 2026
Returns Chart
Key Stats
| Net Expense Ratio | Total Assets Under Management | Weighted Average Dividend Yield | Turnover Ratio (Generic) |
|---|---|---|---|
| 1.71% | 698.88M | -- | 236.0% |
| 1 Year Fund Level Flows | 1 Year Total Returns (Daily) | Annualized Total Returns Since Inception (Daily) | Max Drawdown (Since Inception) |
| 185.63M | 15.72% |
Basic Info
| Investment Strategy | |
| The Fund seeks capital appreciation and preservation. It will invest at least 80% of its assets in long and short positions in equity instruments of any market capitalization. Equity instruments include domestic and foreign common stock, preferred stock, depositary receipts, equity swaps, options and equity index futures. |
| General | |
| Security Type | Mutual Fund |
| Equity Style | -- |
| Broad Asset Class | Alternative |
| Broad Category | Alternative Strategies |
| Global Peer Group | Alternative Long/Short Equity US |
| Peer Group | Alternative Long/Short Equity Funds |
| Global Macro | Alternative Equity |
| US Macro | Alternative Equity Funds |
| YCharts Categorization | -- |
| YCharts Benchmark | -- |
| Prospectus Objective | Alternative Long/Short Equity Funds |
| Fund Owner Firm Name | Counterpoint |
| Broad Asset Class Benchmark Index | |
| ^MSACWINTR | 100.0% |
Net Fund Flows Versus Peer Group
1 Month
% Rank:
18
-598.12M
Peer Group Low
823.99M
Peer Group High
1 Year
% Rank:
19
185.63M
-248.79M
Peer Group Low
5.532B
Peer Group High
3 Months
% Rank:
17
-722.58M
Peer Group Low
2.242B
Peer Group High
3 Years
% Rank:
14
-583.32M
Peer Group Low
9.347B
Peer Group High
6 Months
% Rank:
19
-455.92M
Peer Group Low
3.568B
Peer Group High
5 Years
% Rank:
16
-954.50M
Peer Group Low
9.538B
Peer Group High
YTD
% Rank:
16
-441.75M
Peer Group Low
3.346B
Peer Group High
10 Years
% Rank:
15
-6.742B
Peer Group Low
8.592B
Peer Group High
Date Unavailable
Risk
Performance Versus Peer Group
Annual Total Returns Versus Peers
As of June 10, 2026.
Asset Allocation
As of December 31, 2025.
| Type | % Net |
|---|---|
| Cash | 12.93% |
| Stock | 49.27% |
| Bond | 34.30% |
| Convertible | 0.00% |
| Preferred | 0.00% |
| Other | 3.50% |
Top 10 Holdings
| Name | % Weight | Price | % Change |
|---|---|---|---|
| Fidelity Instl Treasury Portfolio I | 49.64% | 1.00 | 0.00% |
| Counterpoint Quantitative Equity ETF | 10.87% | 49.61 | -0.04% |
| United States of America USGB 06/04/2026 FIX USD Government (Matured) | 8.34% | 100.00 | 0.01% |
|
JPCPILS1 INDEX TRS
|
7.21% | -- | -- |
|
JPCPILS2 INDEX TRS
|
7.20% | -- | -- |
|
JCP1MULS INDEX TRS
|
5.63% | -- | -- |
| United States of America USGB 0.0 09/03/2026 FIX USD Government | 4.96% | 99.14 | 0.01% |
|
JPCPILS3 INDEX TRS
|
1.91% | -- | -- |
|
USD CASH
|
1.85% | -- | -- |
|
MORGAN STANLEY US COUNTERPOINT INDEX TRS
|
0.29% | -- | -- |
Fees & Availability
| Fees | |
| Actual 12B-1 Fee | 0.25% |
| Actual Management Fee | 1.25% |
| Administration Fee | 12.88K% |
| Maximum Front Load | 5.75% |
| Maximum Deferred Load | -- |
| Maximum Redemption Fee | -- |
| General Availability | |
| Available for Insurance Product | No |
| Available for RRSP | No |
| Purchase Details | |
| Open to New Investors |
|
| Minimum Initial Investment | 5000.00 None |
| Minimum Subsequent Investment | 250.00 None |
Basic Info
| Investment Strategy | |
| The Fund seeks capital appreciation and preservation. It will invest at least 80% of its assets in long and short positions in equity instruments of any market capitalization. Equity instruments include domestic and foreign common stock, preferred stock, depositary receipts, equity swaps, options and equity index futures. |
| General | |
| Security Type | Mutual Fund |
| Equity Style | -- |
| Broad Asset Class | Alternative |
| Broad Category | Alternative Strategies |
| Global Peer Group | Alternative Long/Short Equity US |
| Peer Group | Alternative Long/Short Equity Funds |
| Global Macro | Alternative Equity |
| US Macro | Alternative Equity Funds |
| YCharts Categorization | -- |
| YCharts Benchmark | -- |
| Prospectus Objective | Alternative Long/Short Equity Funds |
| Fund Owner Firm Name | Counterpoint |
| Broad Asset Class Benchmark Index | |
| ^MSACWINTR | 100.0% |
Fundamentals
| General | |
| Distribution Yield | -- |
| Dividend Yield TTM (6-8-26) | 0.34% |
| 30-Day SEC Yield | -- |
| 7-Day SEC Yield | -- |
| Number of Holdings | 299 |
| Stock | |
| Weighted Average PE Ratio | 29.49 |
| Weighted Average Price to Sales Ratio | 5.809 |
| Weighted Average Price to Book Ratio | 7.249 |
| Weighted Median ROE | -2.56% |
| Weighted Median ROA | 2.94% |
| ROI (TTM) | 4.31% |
| Return on Investment (TTM) | 4.31% |
| Earning Yield | 0.0568 |
| LT Debt / Shareholders Equity | 1.328 |
| Number of Equity Holdings | 271 |
| Bond | |
| Yield to Maturity (12-31-25) | 3.49% |
| Effective Duration | -- |
| Average Coupon | -- |
| Calculated Average Quality | 5.00 |
| Effective Maturity | 0.3197 |
| Nominal Maturity | 0.3197 |
| Number of Bond Holdings | 2 |
As of December 31, 2025
Growth Metrics
| EPS Growth (1Y) | 24.29% |
| EPS Growth (3Y) | 10.59% |
| EPS Growth (5Y) | 16.18% |
| Sales Growth (1Y) | 13.16% |
| Sales Growth (3Y) | 11.56% |
| Sales Growth (5Y) | 13.87% |
| Sales per Share Growth (1Y) | 13.56% |
| Sales per Share Growth (3Y) | 10.97% |
| Operating Cash Flow - Growth Rate (3Y) | 15.34% |
As of December 31, 2025
Top Portfolio Holders
| Name | % Weight |
|---|---|
| Portfolio A | 5.00% |
| Portfolio B | 3.50% |
| Portfolio C | 2.25% |
Excel Add-In Codes
| Name: =YCI("M:CPAEX", "name") |
| Broad Asset Class: =YCI("M:CPAEX", "broad_asset_class") |
| Broad Category: =YCI("M:CPAEX", "broad_category_group") |
| Prospectus Objective: =YCI("M:CPAEX", "prospectus_objective") |
| To find the codes for any of our securities and financial metrics, see our Complete Excel Reference. |