

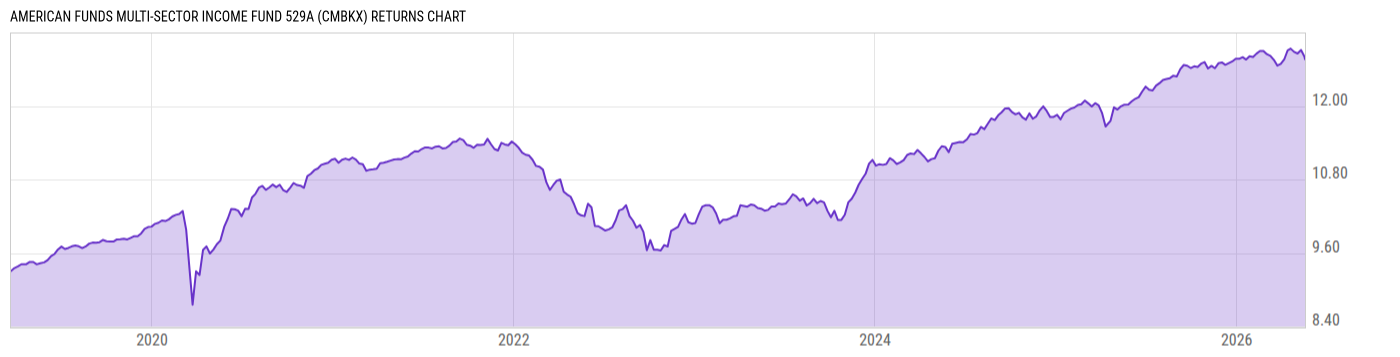
American Funds Multi-Sector Income Fund 529A (CMBKX)
9.33
-0.01
(-0.11%)
USD |
Jun 08 2026
Returns Chart
Key Stats
| Net Expense Ratio | Total Assets Under Management | Weighted Average Dividend Yield | Turnover Ratio (Generic) |
|---|---|---|---|
| 0.72% | 22.23B | -- | 102.0% |
| 1 Year Fund Level Flows | 1 Year Total Returns (Daily) | Annualized Total Returns Since Inception (Daily) | Max Drawdown (Since Inception) |
| 3.046B | 6.46% |
Basic Info
| Investment Strategy | |
| The Fund seeks to provide a high level of current income. Its secondary investment objective is capital appreciation. Normally, it will invest its assets across four primary sectors which are high-yield corporate debt, investment grade corporate debt, debt instruments of emerging market issuers and securitized debt. |
| General | |
| Security Type | Mutual Fund |
| Equity Style | -- |
| Broad Asset Class | Taxable Bond |
| Broad Category | Fixed Income |
| Global Peer Group | Bond Global USD |
| Peer Group | Multi-Sector Income Funds |
| Global Macro | Bond Global |
| US Macro | General Domestic Taxable Fixed Income Funds |
| YCharts Categorization | -- |
| YCharts Benchmark | -- |
| Prospectus Objective | Multi-Sector Income Funds |
| Fund Owner Firm Name | Capital Group/American Funds |
| Broad Asset Class Benchmark Index | |
| ^BBUSATR | 100.0% |
Net Fund Flows Versus Peer Group
1 Month
% Rank:
7
-144.76M
Peer Group Low
572.86M
Peer Group High
1 Year
% Rank:
6
3.046B
-1.545B
Peer Group Low
30.94B
Peer Group High
3 Months
% Rank:
9
-480.71M
Peer Group Low
1.683B
Peer Group High
3 Years
% Rank:
6
-4.573B
Peer Group Low
71.08B
Peer Group High
6 Months
% Rank:
6
-777.58M
Peer Group Low
12.53B
Peer Group High
5 Years
% Rank:
5
-7.509B
Peer Group Low
61.00B
Peer Group High
YTD
% Rank:
6
-627.92M
Peer Group Low
8.773B
Peer Group High
10 Years
% Rank:
5
-13.91B
Peer Group Low
116.77B
Peer Group High
Date Unavailable
Risk
Performance Versus Peer Group
Annual Total Returns Versus Peers
As of June 09, 2026.
Asset Allocation
As of March 31, 2026.
| Type | % Net |
|---|---|
| Cash | 1.37% |
| Stock | 0.49% |
| Bond | 97.18% |
| Convertible | 0.00% |
| Preferred | 0.17% |
| Other | 0.80% |
Top 10 Holdings
| Name | % Weight | Price | % Change |
|---|---|---|---|
|
Capital Group Central Cash Fund; Class M
|
1.37% | -- | -- |
|
Other Assets less Liabilities
|
0.79% | -- | -- |
| Bank of America Corporation BACORP 5.045 02/06/2037 FLT USD Corporate '36 | 0.61% | 97.59 | -0.13% |
| The Goldman Sachs Group, Inc. GS 4.939 10/21/2036 FLT USD Corporate '35 | 0.59% | 96.25 | 0.02% |
| NFE Financing LLC NFEFIN 12.0 11/15/2029 FIX USD Corporate 144A | 0.45% | 35.81 | 0.42% |
| MPT Operating Partnership, L.P. MPW-OPLP 8.5 02/15/2032 FIX USD Corporate 144A | 0.43% | 103.34 | -0.29% |
| United States of America USGB 3.875 03/31/2031 FIX USD Government | 0.38% | 98.37 | -0.03% |
| Jefferies Financial Group Inc. JEFFIN 5.5 02/15/2036 FIX USD Corporate | 0.37% | 96.30 | -0.23% |
| United States of America USGB 4.125 02/15/2036 FIX USD Government | 0.36% | 96.61 | -0.15% |
| ABBVIE INC. ABBVINC 5.05 03/15/2034 FIX USD Corporate | 0.36% | 100.65 | -0.11% |
Fees & Availability
| Fees | |
| Actual 12B-1 Fee | 0.23% |
| Actual Management Fee | 0.33% |
| Administration Fee | -- |
| Maximum Front Load | 3.50% |
| Maximum Deferred Load | -- |
| Maximum Redemption Fee | -- |
| General Availability | |
| Available for Insurance Product | No |
| Available for RRSP | No |
| Purchase Details | |
| Open to New Investors |
|
| Minimum Initial Investment | 250.00 None |
| Minimum Subsequent Investment | 50.00 None |
Basic Info
| Investment Strategy | |
| The Fund seeks to provide a high level of current income. Its secondary investment objective is capital appreciation. Normally, it will invest its assets across four primary sectors which are high-yield corporate debt, investment grade corporate debt, debt instruments of emerging market issuers and securitized debt. |
| General | |
| Security Type | Mutual Fund |
| Equity Style | -- |
| Broad Asset Class | Taxable Bond |
| Broad Category | Fixed Income |
| Global Peer Group | Bond Global USD |
| Peer Group | Multi-Sector Income Funds |
| Global Macro | Bond Global |
| US Macro | General Domestic Taxable Fixed Income Funds |
| YCharts Categorization | -- |
| YCharts Benchmark | -- |
| Prospectus Objective | Multi-Sector Income Funds |
| Fund Owner Firm Name | Capital Group/American Funds |
| Broad Asset Class Benchmark Index | |
| ^BBUSATR | 100.0% |
Fundamentals
| General | |
| Distribution Yield | -- |
| Dividend Yield TTM (6-5-26) | 6.08% |
| 30-Day SEC Yield (4-30-26) | 5.33% |
| 7-Day SEC Yield | -- |
| Number of Holdings | 2322 |
| Bond | |
| Yield to Maturity (3-31-26) | 6.29% |
| Effective Duration | 4.90 |
| Average Coupon | 6.17% |
| Calculated Average Quality | 4.417 |
| Effective Maturity | 9.848 |
| Nominal Maturity | 10.00 |
| Number of Bond Holdings | 2268 |
As of March 31, 2026
Fund Details
| Key Dates | |
| Inception Date | 5/1/2020 |
| Last Annual Report Date | 12/31/2025 |
| Last Prospectus Date | 3/1/2026 |
| Share Classes | |
| CMBLX | 529 Plans |
| CMBMX | 529 Plans |
| CMBOX | 529 Plans |
| CMBPX | 529 Plans |
| CMBQX | 529 Plans |
| MIAQX | A |
| MIAUX | C |
| MIAWX | Other |
| MIAYX | Other |
| MIAZX | F3 |
| RMDNX | Retirement |
| RMDOX | Retirement |
| RMDPX | Other |
| RMDQX | Retirement |
| RMDRX | Retirement |
| RMDSX | Other |
| RMDTX | Retirement |
| RMDUX | Retirement |
| Attributes | |
| Index Fund | -- |
| Inverse Fund | No |
| Leveraged Fund | -- |
| Fund of Funds | No |
| Currency Hedged Fund | -- |
| Socially Responsible Fund | No |
Top Portfolio Holders
| Name | % Weight |
|---|---|
| Portfolio A | 5.00% |
| Portfolio B | 3.50% |
| Portfolio C | 2.25% |
Excel Add-In Codes
| Name: =YCI("M:CMBKX", "name") |
| Broad Asset Class: =YCI("M:CMBKX", "broad_asset_class") |
| Broad Category: =YCI("M:CMBKX", "broad_category_group") |
| Prospectus Objective: =YCI("M:CMBKX", "prospectus_objective") |
| To find the codes for any of our securities and financial metrics, see our Complete Excel Reference. |