

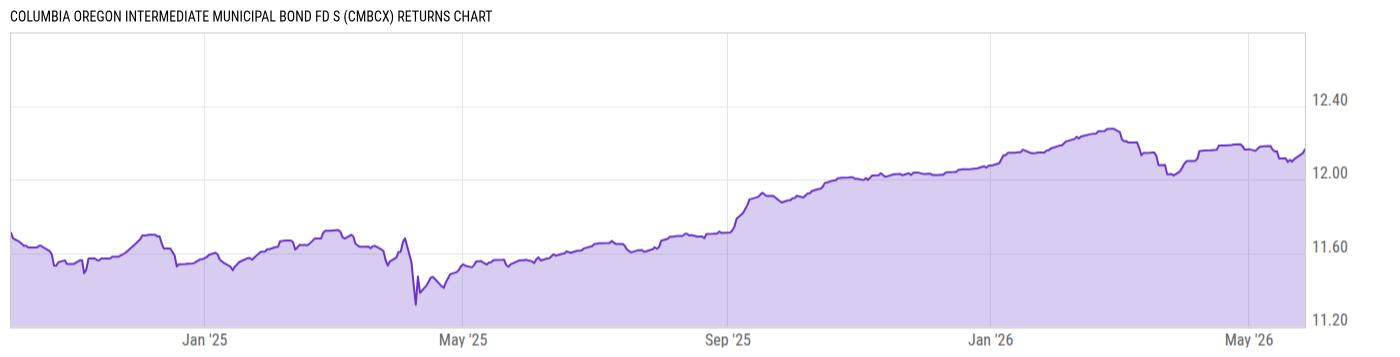
Columbia Oregon Intermediate Municipal Bond Fd S (CMBCX)
11.70
+0.02
(+0.17%)
USD |
May 27 2026
Returns Chart
Key Stats
| Net Expense Ratio | Total Assets Under Management | Weighted Average Dividend Yield | Turnover Ratio (Generic) |
|---|---|---|---|
| 0.59% | 291.92M | -- | 12.00% |
| 1 Year Fund Level Flows | 1 Year Total Returns (Daily) | Annualized Total Returns Since Inception (Daily) | Max Drawdown (Since Inception) |
| -10.47M | 5.24% |
Basic Info
| Investment Strategy | |
| The Fund seeks a high level of income exempt from federal and Oregon income tax by investing, at least 80% of its net assets in municipal securities issued by the State of Oregon. The Fund intends to maintain an average portfolio maturity of approximately 3 to 10 years. |
| General | |
| Security Type | Mutual Fund |
| Equity Style | -- |
| Broad Asset Class | Municipal Bond |
| Broad Category | Fixed Income |
| Global Peer Group | Bond USD Municipal |
| Peer Group | Other States Intermediate Muni Debt Fds |
| Global Macro | Bond HC |
| US Macro | Single State Municipal Debt Funds |
| YCharts Categorization | -- |
| YCharts Benchmark | -- |
| Prospectus Objective | Other States Intermediate Muni Debt Fds |
| Fund Owner Firm Name | Columbia Threadneedle Investments |
| Broad Asset Class Benchmark Index | |
| ^BBMBTR | 100.0% |
Net Fund Flows Versus Peer Group
1 Month
% Rank:
93
-2.813M
Peer Group Low
6.923M
Peer Group High
1 Year
% Rank:
74
-10.47M
-20.96M
Peer Group Low
62.92M
Peer Group High
3 Months
% Rank:
93
-13.42M
Peer Group Low
18.18M
Peer Group High
3 Years
% Rank:
43
-130.91M
Peer Group Low
33.14M
Peer Group High
6 Months
% Rank:
84
-16.57M
Peer Group Low
27.53M
Peer Group High
5 Years
% Rank:
58
-205.98M
Peer Group Low
-8.630M
Peer Group High
YTD
% Rank:
89
-11.62M
Peer Group Low
20.78M
Peer Group High
10 Years
% Rank:
91
-228.81M
Peer Group Low
94.61M
Peer Group High
Date Unavailable
Risk
Performance Versus Peer Group
Annual Total Returns Versus Peers
As of May 28, 2026.
Asset Allocation
As of March 31, 2026.
| Type | % Net |
|---|---|
| Cash | 0.01% |
| Stock | 0.00% |
| Bond | 99.26% |
| Convertible | 0.00% |
| Preferred | 0.00% |
| Other | 0.73% |
Top 10 Holdings
| Name | % Weight | Price | % Change |
|---|---|---|---|
| OREGON HEALTH SCIENCES UNIV REV OR 5.000 07/01/2034 | 2.59% | 100.16 | -0.00% |
| PORTLAND ORE WTR SYS REV OR 4.000 04/01/2030 | 2.53% | 100.01 | 0.00% |
| TRI-CNTY MET TRANSN DIST ORE REV OR 5.000 10/01/2032 | 2.42% | 103.31 | 0.03% |
| OREGON HEALTH SCIENCES UNIV REV OR 5.000 07/01/2032 | 1.89% | 106.08 | 0.06% |
| PORTLAND ORE SWR SYS REV OR 5.000 12/01/2042 | 1.85% | 107.44 | 0.12% |
| OREGON ST DEPT TRANSN HWY USER TAX REV OR 5.000 11/15/2037 | 1.78% | 106.11 | 0.08% |
| OREGON ST HSG & CMNTY SVCS DEPT MULTIFAMILY REV OR 4.000 01/10/2048 | 1.75% | 102.21 | 0.03% |
| PUERTO RICO PUB FIN CORP PR 6.000 08/01/2026 | 1.73% | 100.60 | -0.54% |
| PORT PORTLAND ORE ARPT REV OR 4.000 07/01/2039 | 1.66% | 97.75 | 0.20% |
| WASHINGTON CLACKAMAS & YAMHILL CNTYS ORE SCH DIST NO 88J OR 5.000 06/15/2031 | 1.58% | 102.07 | 0.01% |
Fees & Availability
| Fees | |
| Actual 12B-1 Fee | -- |
| Actual Management Fee | 0.46% |
| Administration Fee | -- |
| Maximum Front Load | -- |
| Maximum Deferred Load | -- |
| Maximum Redemption Fee | -- |
| General Availability | |
| Available for Insurance Product | No |
| Available for RRSP | No |
| Purchase Details | |
| Open to New Investors |
|
| Minimum Initial Investment | 0.00 None |
| Minimum Subsequent Investment | 0.00 None |
Basic Info
| Investment Strategy | |
| The Fund seeks a high level of income exempt from federal and Oregon income tax by investing, at least 80% of its net assets in municipal securities issued by the State of Oregon. The Fund intends to maintain an average portfolio maturity of approximately 3 to 10 years. |
| General | |
| Security Type | Mutual Fund |
| Equity Style | -- |
| Broad Asset Class | Municipal Bond |
| Broad Category | Fixed Income |
| Global Peer Group | Bond USD Municipal |
| Peer Group | Other States Intermediate Muni Debt Fds |
| Global Macro | Bond HC |
| US Macro | Single State Municipal Debt Funds |
| YCharts Categorization | -- |
| YCharts Benchmark | -- |
| Prospectus Objective | Other States Intermediate Muni Debt Fds |
| Fund Owner Firm Name | Columbia Threadneedle Investments |
| Broad Asset Class Benchmark Index | |
| ^BBMBTR | 100.0% |
Fundamentals
| General | |
| Distribution Yield | -- |
| Dividend Yield TTM (5-27-26) | 2.49% |
| 30-Day SEC Yield (4-30-26) | 2.70% |
| 7-Day SEC Yield | -- |
| Number of Holdings | 187 |
| Bond | |
| Yield to Maturity (3-31-26) | 3.38% |
| Effective Duration | 4.96 |
| Average Coupon | 4.74% |
| Calculated Average Quality | 2.146 |
| Effective Maturity | 6.999 |
| Nominal Maturity | 10.15 |
| Number of Bond Holdings | 181 |
As of March 31, 2026
Fund Details
Top Portfolio Holders
| Name | % Weight |
|---|---|
| Portfolio A | 5.00% |
| Portfolio B | 3.50% |
| Portfolio C | 2.25% |
Excel Add-In Codes
| Name: =YCI("M:CMBCX", "name") |
| Broad Asset Class: =YCI("M:CMBCX", "broad_asset_class") |
| Broad Category: =YCI("M:CMBCX", "broad_category_group") |
| Prospectus Objective: =YCI("M:CMBCX", "prospectus_objective") |
| To find the codes for any of our securities and financial metrics, see our Complete Excel Reference. |