

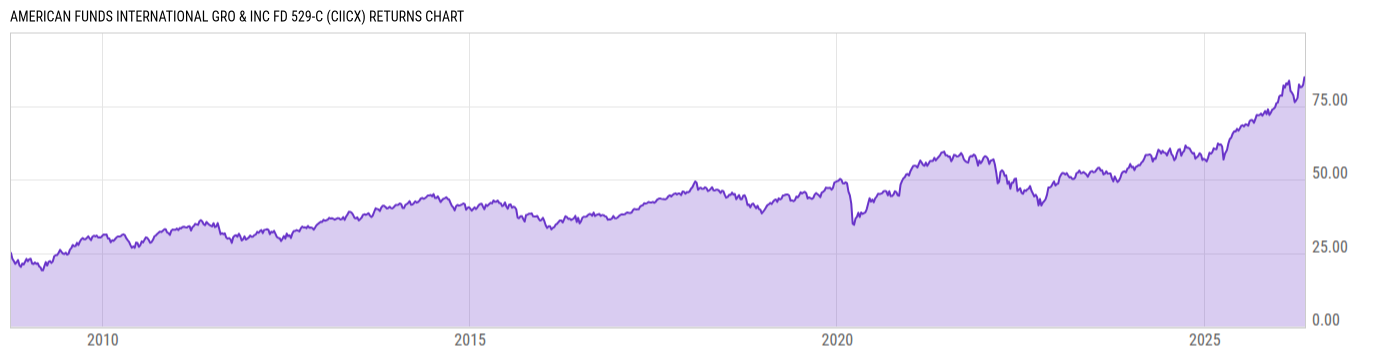
American Funds International Gro & Inc Fd 529-C (CIICX)
49.79
-0.33
(-0.66%)
USD |
Jun 03 2026
Returns Chart
Key Stats
| Net Expense Ratio | Total Assets Under Management | Weighted Average Dividend Yield | Turnover Ratio (Generic) |
|---|---|---|---|
| 1.70% | 20.00B | 2.63% | 40.00% |
| 1 Year Fund Level Flows | 1 Year Total Returns (Daily) | Annualized Total Returns Since Inception (Daily) | Max Drawdown (Since Inception) |
| -1.033B | 28.40% |
Basic Info
| Investment Strategy | |
| The Fund seeks long-term growth of capital while providing current income. The Fund invests primarily in stocks of companies domiciled outside the United States, including in emerging markets and developing countries, that the investment adviser believes have the potential for growth and/or to pay dividends. |
| General | |
| Security Type | Mutual Fund |
| Equity Style | Large Cap Core |
| Broad Asset Class | International Equity |
| Broad Category | Equity |
| Global Peer Group | Equity Global ex US |
| Peer Group | International Large-Cap Core |
| Global Macro | Equity Global |
| US Macro | Developed International Markets Funds |
| YCharts Categorization | -- |
| YCharts Benchmark | -- |
| Prospectus Objective | International Funds |
| Fund Owner Firm Name | Capital Group/American Funds |
| Broad Asset Class Benchmark Index | |
| ^MSACXUSNTR | 100.0% |
Net Fund Flows Versus Peer Group
1 Month
% Rank:
88
-1.416B
Peer Group Low
2.961B
Peer Group High
1 Year
% Rank:
89
-1.033B
-4.826B
Peer Group Low
8.774B
Peer Group High
3 Months
% Rank:
16
-1.893B
Peer Group Low
1.759B
Peer Group High
3 Years
% Rank:
92
-8.607B
Peer Group Low
13.83B
Peer Group High
6 Months
% Rank:
86
-3.457B
Peer Group Low
5.948B
Peer Group High
5 Years
% Rank:
92
-11.24B
Peer Group Low
20.98B
Peer Group High
YTD
% Rank:
62
-2.548B
Peer Group Low
4.939B
Peer Group High
10 Years
% Rank:
91
-34.06B
Peer Group Low
36.47B
Peer Group High
Date Unavailable
Risk
Performance Versus Peer Group
Annual Total Returns Versus Peers
As of June 04, 2026.
Asset Allocation
As of March 31, 2026.
| Type | % Net |
|---|---|
| Cash | 4.15% |
| Stock | 94.92% |
| Bond | 0.00% |
| Convertible | 0.00% |
| Preferred | 0.04% |
| Other | 0.89% |
Top 10 Holdings
| Name | % Weight | Price | % Change |
|---|---|---|---|
| Taiwan Semiconductor Manufacturing Co., Ltd. | 4.77% | 17.24 | 0.00% |
|
Capital Group Central Cash Fund; Class M
|
4.15% | -- | -- |
| TotalEnergies SE | 2.16% | 89.58 | 0.20% |
| ASML Holding NV | 2.10% | 1736.00 | 2.39% |
| AstraZeneca PLC | 2.02% | 176.28 | -0.66% |
| BAE Systems Plc | 1.97% | 25.52 | -3.11% |
| Samsung Electronics Co., Ltd. | 1.38% | 140.00 | 0.00% |
| British American Tobacco plc | 1.25% | 58.53 | -3.51% |
| Industria de Diseño Textil SA | 1.24% | 61.83 | 3.39% |
| Nestlé SA | 1.20% | 98.75 | 1.76% |
Fees & Availability
| Fees | |
| Actual 12B-1 Fee | 1.00% |
| Actual Management Fee | 0.48% |
| Administration Fee | -- |
| Maximum Front Load | -- |
| Maximum Deferred Load | 1.00% |
| Maximum Redemption Fee | -- |
| General Availability | |
| Available for Insurance Product | No |
| Available for RRSP | No |
| Purchase Details | |
| Open to New Investors |
|
| Minimum Initial Investment | 250.00 None |
| Minimum Subsequent Investment | 50.00 None |
Basic Info
| Investment Strategy | |
| The Fund seeks long-term growth of capital while providing current income. The Fund invests primarily in stocks of companies domiciled outside the United States, including in emerging markets and developing countries, that the investment adviser believes have the potential for growth and/or to pay dividends. |
| General | |
| Security Type | Mutual Fund |
| Equity Style | Large Cap Core |
| Broad Asset Class | International Equity |
| Broad Category | Equity |
| Global Peer Group | Equity Global ex US |
| Peer Group | International Large-Cap Core |
| Global Macro | Equity Global |
| US Macro | Developed International Markets Funds |
| YCharts Categorization | -- |
| YCharts Benchmark | -- |
| Prospectus Objective | International Funds |
| Fund Owner Firm Name | Capital Group/American Funds |
| Broad Asset Class Benchmark Index | |
| ^MSACXUSNTR | 100.0% |
Fundamentals
| General | |
| Distribution Yield | -- |
| Dividend Yield TTM (6-2-26) | 1.67% |
| 30-Day SEC Yield (4-30-26) | 1.20% |
| 7-Day SEC Yield | -- |
| Number of Holdings | 299 |
| Stock | |
| Weighted Average PE Ratio | 22.39 |
| Weighted Average Price to Sales Ratio | 3.932 |
| Weighted Average Price to Book Ratio | 4.243 |
| Weighted Median ROE | 21.00% |
| Weighted Median ROA | 7.81% |
| ROI (TTM) | 12.97% |
| Return on Investment (TTM) | 12.97% |
| Earning Yield | 0.0588 |
| LT Debt / Shareholders Equity | 0.7001 |
| Number of Equity Holdings | 292 |
As of March 31, 2026
Growth Metrics
| EPS Growth (1Y) | 22.69% |
| EPS Growth (3Y) | 10.73% |
| EPS Growth (5Y) | 16.48% |
| Sales Growth (1Y) | 8.41% |
| Sales Growth (3Y) | 7.39% |
| Sales Growth (5Y) | 10.15% |
| Sales per Share Growth (1Y) | 9.32% |
| Sales per Share Growth (3Y) | 7.82% |
| Operating Cash Flow - Growth Rate (3Y) | 11.22% |
As of March 31, 2026
Fund Details
| Key Dates | |
| Inception Date | 10/1/2008 |
| Last Annual Report Date | 6/30/2025 |
| Last Prospectus Date | 9/1/2025 |
| Share Classes | |
| CGIAX | 529 Plans |
| CGIEX | 529 Plans |
| CGIFX | 529 Plans |
| FGGGX | 529 Plans |
| FGIGX | 529 Plans |
| IGAAX | A |
| IGAIX | F3 |
| IGFFX | Other |
| IGICX | C |
| IGIFX | Other |
| RGICX | Retirement |
| RIGAX | Retirement |
| RIGBX | Retirement |
| RIGEX | Retirement |
| RIGFX | Retirement |
| RIGGX | Retirement |
| RIGIX | Other |
| RIIEX | Other |
| Attributes | |
| Index Fund | -- |
| Inverse Fund | No |
| Leveraged Fund | -- |
| Fund of Funds | No |
| Currency Hedged Fund | -- |
| Socially Responsible Fund | No |
Top Portfolio Holders
| Name | % Weight |
|---|---|
| Portfolio A | 5.00% |
| Portfolio B | 3.50% |
| Portfolio C | 2.25% |
Excel Add-In Codes
| Name: =YCI("M:CIICX", "name") |
| Broad Asset Class: =YCI("M:CIICX", "broad_asset_class") |
| Broad Category: =YCI("M:CIICX", "broad_category_group") |
| Prospectus Objective: =YCI("M:CIICX", "prospectus_objective") |
| To find the codes for any of our securities and financial metrics, see our Complete Excel Reference. |