

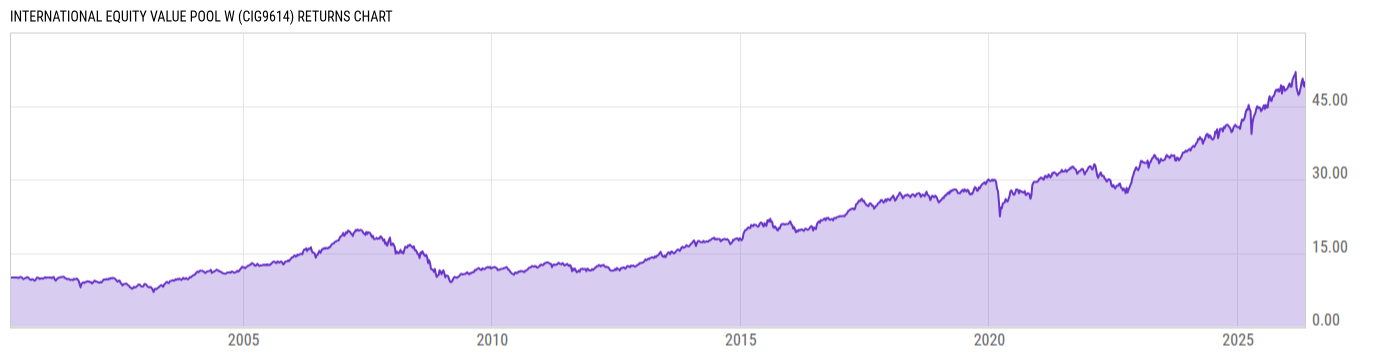
International Equity Value Pool W (CIG9614)
42.28
0.00 (0.00%)
CAD |
May 08 2026
Returns Chart
Key Stats
| Net Expense Ratio | Total Assets Under Management | Weighted Average Dividend Yield | Turnover Ratio (Generic) |
|---|---|---|---|
| 0.18% | 378.74M | 2.58% | 14.30% |
| 1 Year Fund Level Flows | 1 Year Total Returns (Daily) | Annualized Total Returns Since Inception (Daily) | Max Drawdown (Since Inception) |
| -52.94M | 14.56% |
Basic Info
| Investment Strategy | |
| The primary investment objective of the International Equity Value Pool is to provide long-term capital appreciation primarily through investment in a diversified portfolio of equity and equity-related securities of international issuers which are believed to be undervalued relative to their perceived growth potential. Equity-related securities include convertible preferred shares, convertible debt obligations and warrants. The portfolio advisors will not invest in Canadian or US issuers. Any change to the investment objectives must be approved by a majority of the votes cast by unitholders at a meeting called to consider the change. |
| General | |
| Security Type | Mutual Fund |
| Equity Style | Large Cap Value |
| Broad Asset Class | International Equity |
| Broad Category | Equity |
| Global Peer Group | Equity Global ex US |
| Peer Group | International Equity |
| Global Macro | Equity Global |
| US Macro | -- |
| YCharts Categorization | -- |
| YCharts Benchmark | -- |
| Prospectus Objective | -- |
| Fund Owner Firm Name | CI Global Asset Management |
| Broad Asset Class Benchmark Index | |
| ^SPTSX60TR | 100.0% |
Net Fund Flows Versus Peer Group
1 Month
% Rank:
70
-705.77M
Peer Group Low
536.97M
Peer Group High
1 Year
% Rank:
91
-52.94M
-1.528B
Peer Group Low
6.167B
Peer Group High
3 Months
% Rank:
62
-682.88M
Peer Group Low
1.957B
Peer Group High
3 Years
% Rank:
88
-3.220B
Peer Group Low
9.757B
Peer Group High
6 Months
% Rank:
71
-724.34M
Peer Group Low
3.782B
Peer Group High
5 Years
% Rank:
86
-3.166B
Peer Group Low
10.98B
Peer Group High
YTD
% Rank:
64
-673.01M
Peer Group Low
2.721B
Peer Group High
10 Years
% Rank:
86
-3.211B
Peer Group Low
14.39B
Peer Group High
Date Unavailable
Risk
Performance Versus Peer Group
Annual Total Returns Versus Peers
As of May 09, 2026.
Asset Allocation
As of March 31, 2026.
| Type | % Net |
|---|---|
| Cash | 4.20% |
| Stock | 95.52% |
| Bond | 0.00% |
| Convertible | 0.00% |
| Preferred | 0.00% |
| Other | 0.28% |
Top 10 Holdings
| Name | % Weight | Price | % Change |
|---|---|---|---|
| Chubb Ltd. | 3.96% | 319.64 | -0.51% |
|
CAD CASH
|
3.83% | -- | -- |
| TotalEnergies SE | 3.18% | 88.48 | -0.28% |
| Deutsche Börse AG | 3.04% | 288.50 | 0.98% |
| Everest Group Ltd. | 2.76% | 351.52 | -0.06% |
| GSK Plc | 2.52% | 25.26 | 0.00% |
| Sanofi | 2.37% | 84.22 | -2.43% |
| Sumitomo Mitsui Trust Group, Inc. | 2.30% | 34.15 | 0.00% |
| Sony Group Corp. | 2.21% | 19.59 | 2.96% |
| Aon Plc | 2.20% | 312.79 | -0.26% |
Fees & Availability
| Fees | |
| Actual 12B-1 Fee | -- |
| Actual Management Fee | -- |
| Administration Fee | -- |
| Maximum Front Load | -- |
| Maximum Deferred Load | -- |
| Maximum Redemption Fee | -- |
| General Availability | |
| Available for Insurance Product | No |
| Available for RRSP |
|
| Purchase Details | |
| Open to New Investors |
|
| Minimum Initial Investment | 100000.0 None |
| Minimum Subsequent Investment | 50.00 None |
Basic Info
| Investment Strategy | |
| The primary investment objective of the International Equity Value Pool is to provide long-term capital appreciation primarily through investment in a diversified portfolio of equity and equity-related securities of international issuers which are believed to be undervalued relative to their perceived growth potential. Equity-related securities include convertible preferred shares, convertible debt obligations and warrants. The portfolio advisors will not invest in Canadian or US issuers. Any change to the investment objectives must be approved by a majority of the votes cast by unitholders at a meeting called to consider the change. |
| General | |
| Security Type | Mutual Fund |
| Equity Style | Large Cap Value |
| Broad Asset Class | International Equity |
| Broad Category | Equity |
| Global Peer Group | Equity Global ex US |
| Peer Group | International Equity |
| Global Macro | Equity Global |
| US Macro | -- |
| YCharts Categorization | -- |
| YCharts Benchmark | -- |
| Prospectus Objective | -- |
| Fund Owner Firm Name | CI Global Asset Management |
| Broad Asset Class Benchmark Index | |
| ^SPTSX60TR | 100.0% |
Fundamentals
| General | |
| Distribution Yield | -- |
| Dividend Yield TTM (5-8-26) | 2.66% |
| 30-Day SEC Yield | -- |
| 7-Day SEC Yield | -- |
| Number of Holdings | 10 |
| Stock | |
| Weighted Average PE Ratio | 18.30 |
| Weighted Average Price to Sales Ratio | 2.571 |
| Weighted Average Price to Book Ratio | 2.725 |
| Weighted Median ROE | 16.46% |
| Weighted Median ROA | 4.52% |
| ROI (TTM) | 11.23% |
| Return on Investment (TTM) | 11.23% |
| Earning Yield | 0.0645 |
| LT Debt / Shareholders Equity | 0.6567 |
| Number of Equity Holdings | 9 |
As of March 31, 2026
Growth Metrics
| EPS Growth (1Y) | 18.83% |
| EPS Growth (3Y) | 11.24% |
| EPS Growth (5Y) | 11.88% |
| Sales Growth (1Y) | 5.46% |
| Sales Growth (3Y) | 5.93% |
| Sales Growth (5Y) | 8.32% |
| Sales per Share Growth (1Y) | 7.19% |
| Sales per Share Growth (3Y) | 7.22% |
| Operating Cash Flow - Growth Rate (3Y) | 9.38% |
As of March 31, 2026
Fund Details
| Key Dates | |
| Launch Date | 4/28/2000 |
| Last Annual Report Date | 6/30/2025 |
| Last Prospectus Date | -- |
| Share Classes | |
| CIG16464 | Institutional |
| CIG16664 | Commission-based Advice |
| CIG19314 | Fee-based Advice |
| CIG19664 | Commission-based Advice |
| CIG80582 | Fee-based Advice |
| Attributes | |
| Index Fund | -- |
| Inverse Fund | No |
| Leveraged Fund | -- |
| Fund of Funds | No |
| Currency Hedged Fund | -- |
| Socially Responsible Fund | No |
Top Portfolio Holders
| Name | % Weight |
|---|---|
| Portfolio A | 5.00% |
| Portfolio B | 3.50% |
| Portfolio C | 2.25% |
Excel Add-In Codes
| Name: =YCI("M:CIG9614", "name") |
| Broad Asset Class: =YCI("M:CIG9614", "broad_asset_class") |
| Broad Category: =YCI("M:CIG9614", "broad_category_group") |
| Prospectus Objective: =YCI("M:CIG9614", "prospectus_objective") |
| To find the codes for any of our securities and financial metrics, see our Complete Excel Reference. |