

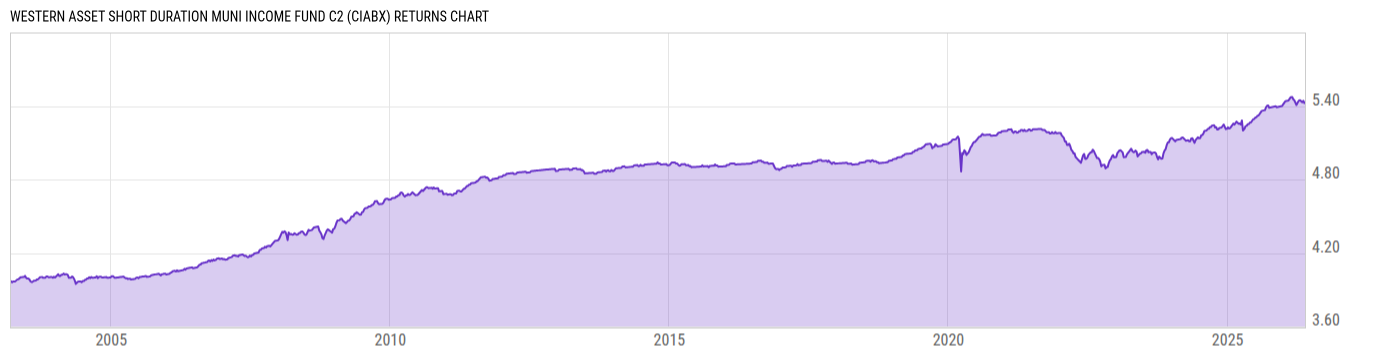
Western Asset Short Duration Muni Income Fund C2 (CIABX)
5.05
0.00 (0.00%)
USD |
May 22 2026
Returns Chart
Key Stats
| Net Expense Ratio | Total Assets Under Management | Weighted Average Dividend Yield | Turnover Ratio (Generic) |
|---|---|---|---|
| 1.12% | 273.70M | -- | 26.00% |
| 1 Year Fund Level Flows | 1 Year Total Returns (Daily) | Annualized Total Returns Since Inception (Daily) | Max Drawdown (Since Inception) |
| -41.79M | 3.27% |
Basic Info
| Investment Strategy | |
| The Fund seeks to generate high current income exempt from regular federal income tax while preserving capital. Under normal circumstances, the Fund invests at least 80% of its assets in municipal securities. The Fund will normally maintain an average portfolio duration of three years or less. |
| General | |
| Security Type | Mutual Fund |
| Equity Style | -- |
| Broad Asset Class | Municipal Bond |
| Broad Category | Fixed Income |
| Global Peer Group | Bond USD Municipal Short Term |
| Peer Group | Short Municipal Debt Funds |
| Global Macro | -- |
| US Macro | National Municipal Debt Funds |
| YCharts Categorization | -- |
| YCharts Benchmark | -- |
| Prospectus Objective | Short Municipal Debt Funds |
| Fund Owner Firm Name | Franklin Templeton |
| Broad Asset Class Benchmark Index | |
| ^BBMBTR | 100.0% |
Net Fund Flows Versus Peer Group
1 Month
% Rank:
48
-163.19M
Peer Group Low
105.80M
Peer Group High
1 Year
% Rank:
90
-41.79M
-452.89M
Peer Group Low
2.569B
Peer Group High
3 Months
% Rank:
62
-236.38M
Peer Group Low
641.38M
Peer Group High
3 Years
% Rank:
82
-2.025B
Peer Group Low
3.410B
Peer Group High
6 Months
% Rank:
76
-296.14M
Peer Group Low
947.01M
Peer Group High
5 Years
% Rank:
66
-7.012B
Peer Group Low
4.135B
Peer Group High
YTD
% Rank:
68
-240.69M
Peer Group Low
641.38M
Peer Group High
10 Years
% Rank:
93
-4.632B
Peer Group Low
5.923B
Peer Group High
Date Unavailable
Risk
Performance Versus Peer Group
Annual Total Returns Versus Peers
As of May 24, 2026.
Asset Allocation
As of March 31, 2026.
| Type | % Net |
|---|---|
| Cash | 0.01% |
| Stock | 0.00% |
| Bond | 99.62% |
| Convertible | 0.00% |
| Preferred | 0.00% |
| Other | 0.37% |
Top 10 Holdings
| Name | % Weight | Price | % Change |
|---|---|---|---|
| INDIANAPOLIS IND LOC PUB IMPT BD BK IN 5.000 01/01/2029 | 2.59% | 104.31 | 0.03% |
| CONNECTICUT ST CT 4.000 08/15/2030 | 2.55% | 100.28 | -0.01% |
| DENVER COLO CITY & CNTY ARPT REV CO 5.000 12/01/2031 | 2.39% | 103.83 | 0.03% |
| TRIBOROUGH BRDG & TUNL AUTH N Y PAYROLL MOBILITY TAX NY 5.000 03/15/2029 | 2.32% | 106.22 | 0.03% |
| NEW JERSEY ST TRANSN TR FD AUTH NJ 0.000 12/15/2027 | 1.94% | 95.62 | 0.06% |
| LONG IS PWR AUTH N Y ELEC SYS REV NY 3.000 09/01/2049 | 1.82% | 99.40 | 0.06% |
| SAN FRANCISCO CALIF CITY & CNTY ARPTS COMMN INTL ARPT REV CA 5.000 05/01/2030 | 1.82% | 107.14 | 0.05% |
| NEW JERSEY ECONOMIC DEV AUTH MTR VEH SURCHARGES REV NJ 5.000 07/01/2028 | 1.79% | 101.93 | 0.00% |
| ST JOHN BAPTIST PARISH LA REV LA 2.375 06/01/2037 | 1.74% | 99.97 | 0.00% |
| LOS ANGELES CALIF DEPT ARPTS ARPT REV CA 5.000 05/15/2029 | 1.71% | 102.87 | 0.01% |
Fees & Availability
| Fees | |
| Actual 12B-1 Fee | 0.65% |
| Actual Management Fee | 0.30% |
| Administration Fee | -- |
| Maximum Front Load | -- |
| Maximum Deferred Load | -- |
| Maximum Redemption Fee | -- |
| General Availability | |
| Available for Insurance Product | -- |
| Available for RRSP | -- |
| Purchase Details | |
| Open to New Investors |
|
| Minimum Initial Investment | 1000.00 None |
| Minimum Subsequent Investment | 50.00 None |
Basic Info
| Investment Strategy | |
| The Fund seeks to generate high current income exempt from regular federal income tax while preserving capital. Under normal circumstances, the Fund invests at least 80% of its assets in municipal securities. The Fund will normally maintain an average portfolio duration of three years or less. |
| General | |
| Security Type | Mutual Fund |
| Equity Style | -- |
| Broad Asset Class | Municipal Bond |
| Broad Category | Fixed Income |
| Global Peer Group | Bond USD Municipal Short Term |
| Peer Group | Short Municipal Debt Funds |
| Global Macro | -- |
| US Macro | National Municipal Debt Funds |
| YCharts Categorization | -- |
| YCharts Benchmark | -- |
| Prospectus Objective | Short Municipal Debt Funds |
| Fund Owner Firm Name | Franklin Templeton |
| Broad Asset Class Benchmark Index | |
| ^BBMBTR | 100.0% |
Fundamentals
| General | |
| Distribution Yield | -- |
| Dividend Yield TTM (5-21-26) | 2.02% |
| 30-Day SEC Yield (4-30-26) | 1.77% |
| 7-Day SEC Yield | -- |
| Number of Holdings | 10 |
| Bond | |
| Yield to Maturity (3-31-26) | 2.98% |
| Effective Duration | 2.19 |
| Average Coupon | 4.32% |
| Calculated Average Quality | 2.534 |
| Effective Maturity | 7.748 |
| Nominal Maturity | 8.417 |
| Number of Bond Holdings | 10 |
As of March 31, 2026
Fund Details
Top Portfolio Holders
| Name | % Weight |
|---|---|
| Portfolio A | 5.00% |
| Portfolio B | 3.50% |
| Portfolio C | 2.25% |
Excel Add-In Codes
| Name: =YCI("M:CIABX", "name") |
| Broad Asset Class: =YCI("M:CIABX", "broad_asset_class") |
| Broad Category: =YCI("M:CIABX", "broad_category_group") |
| Prospectus Objective: =YCI("M:CIABX", "prospectus_objective") |
| To find the codes for any of our securities and financial metrics, see our Complete Excel Reference. |