

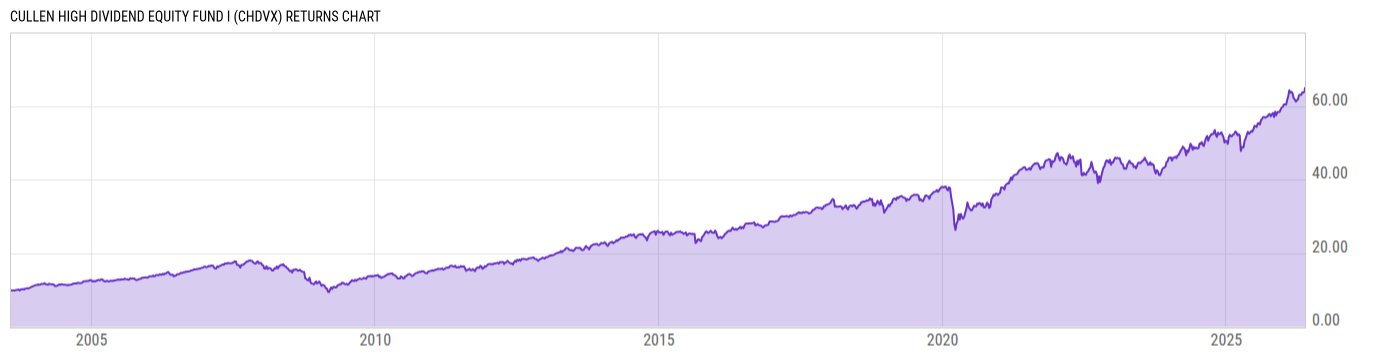
Cullen High Dividend Equity Fund I (CHDVX)
14.25
+0.10
(+0.71%)
USD |
May 22 2026
Returns Chart
Key Stats
| Net Expense Ratio | Total Assets Under Management | Weighted Average Dividend Yield | Turnover Ratio (Generic) |
|---|---|---|---|
| 0.75% | 666.32M | 2.92% | 37.00% |
| 1 Year Fund Level Flows | 1 Year Total Returns (Daily) | Annualized Total Returns Since Inception (Daily) | Max Drawdown (Since Inception) |
| -123.10M | 25.29% |
Basic Info
| Investment Strategy | |
| The Fund seeks long-term capital appreciation with current income being a secondary objective by primarily investing in common stocks of medium- and large-capitalization companies. To generate additional income, the Fund will selectively write covered call options. |
| General | |
| Security Type | Mutual Fund |
| Equity Style | Large Cap Value |
| Broad Asset Class | US Equity |
| Broad Category | Equity |
| Global Peer Group | Equity US |
| Peer Group | Large-Cap Value Funds |
| Global Macro | Equity North America |
| US Macro | Large-Cap Funds |
| YCharts Categorization | -- |
| YCharts Benchmark | -- |
| Prospectus Objective | Growth & Income Funds |
| Fund Owner Firm Name | Cullen Capital Management |
| Broad Asset Class Benchmark Index | |
| ^SPXTR | 100.0% |
Net Fund Flows Versus Peer Group
1 Month
% Rank:
54
-2.064B
Peer Group Low
712.30M
Peer Group High
1 Year
% Rank:
54
-123.10M
-10.92B
Peer Group Low
3.743B
Peer Group High
3 Months
% Rank:
50
-4.066B
Peer Group Low
1.385B
Peer Group High
3 Years
% Rank:
58
-30.39B
Peer Group Low
19.48B
Peer Group High
6 Months
% Rank:
53
-7.282B
Peer Group Low
3.021B
Peer Group High
5 Years
% Rank:
60
-40.74B
Peer Group Low
19.48B
Peer Group High
YTD
% Rank:
48
-5.212B
Peer Group Low
1.984B
Peer Group High
10 Years
% Rank:
69
-41.99B
Peer Group Low
19.48B
Peer Group High
Date Unavailable
Risk
Performance Versus Peer Group
Annual Total Returns Versus Peers
As of May 24, 2026.
Asset Allocation
As of December 31, 2025.
| Type | % Net |
|---|---|
| Cash | 1.24% |
| Stock | 98.45% |
| Bond | 0.00% |
| Convertible | 0.00% |
| Preferred | 0.00% |
| Other | 0.31% |
Top 10 Holdings
| Name | % Weight | Price | % Change |
|---|---|---|---|
| Johnson & Johnson | 3.68% | 234.34 | 1.13% |
| Citigroup, Inc. | 3.54% | 125.09 | -0.10% |
| Morgan Stanley | 3.53% | 201.03 | 0.26% |
| Bank of America Corp. | 3.44% | 51.80 | 0.60% |
| RTX Corp. | 3.40% | 177.01 | 0.59% |
| Cisco Systems, Inc. | 3.38% | 120.41 | 1.87% |
| Siemens AG | 3.29% | 155.30 | 0.05% |
| The Travelers Cos., Inc. | 3.28% | 306.46 | -0.25% |
| JPMorgan Chase & Co. | 3.26% | 306.38 | 1.12% |
| NextEra Energy, Inc. | 3.11% | 88.55 | -1.27% |
Fees & Availability
| Fees | |
| Actual 12B-1 Fee | -- |
| Actual Management Fee | 0.64% |
| Administration Fee | 203.9K% |
| Maximum Front Load | -- |
| Maximum Deferred Load | -- |
| Maximum Redemption Fee | 2.00% |
| General Availability | |
| Available for Insurance Product | No |
| Available for RRSP | No |
| Purchase Details | |
| Open to New Investors |
|
| Minimum Initial Investment | 1.00M None |
| Minimum Subsequent Investment | 100.00 None |
Basic Info
| Investment Strategy | |
| The Fund seeks long-term capital appreciation with current income being a secondary objective by primarily investing in common stocks of medium- and large-capitalization companies. To generate additional income, the Fund will selectively write covered call options. |
| General | |
| Security Type | Mutual Fund |
| Equity Style | Large Cap Value |
| Broad Asset Class | US Equity |
| Broad Category | Equity |
| Global Peer Group | Equity US |
| Peer Group | Large-Cap Value Funds |
| Global Macro | Equity North America |
| US Macro | Large-Cap Funds |
| YCharts Categorization | -- |
| YCharts Benchmark | -- |
| Prospectus Objective | Growth & Income Funds |
| Fund Owner Firm Name | Cullen Capital Management |
| Broad Asset Class Benchmark Index | |
| ^SPXTR | 100.0% |
Fundamentals
| General | |
| Distribution Yield | -- |
| Dividend Yield TTM (5-21-26) | 2.22% |
| 30-Day SEC Yield (3-31-26) | 1.96% |
| 7-Day SEC Yield | -- |
| Number of Holdings | 44 |
| Stock | |
| Weighted Average PE Ratio | 21.25 |
| Weighted Average Price to Sales Ratio | 4.154 |
| Weighted Average Price to Book Ratio | 3.833 |
| Weighted Median ROE | 13.27% |
| Weighted Median ROA | 6.65% |
| ROI (TTM) | 11.76% |
| Return on Investment (TTM) | 11.76% |
| Earning Yield | 0.0606 |
| LT Debt / Shareholders Equity | 0.8126 |
| Number of Equity Holdings | 42 |
As of December 31, 2025
Growth Metrics
| EPS Growth (1Y) | 16.07% |
| EPS Growth (3Y) | 3.91% |
| EPS Growth (5Y) | 9.52% |
| Sales Growth (1Y) | 5.00% |
| Sales Growth (3Y) | 6.84% |
| Sales Growth (5Y) | 6.62% |
| Sales per Share Growth (1Y) | 6.03% |
| Sales per Share Growth (3Y) | 7.91% |
| Operating Cash Flow - Growth Rate (3Y) | 0.14% |
As of December 31, 2025
Fund Details
Top Portfolio Holders
| Name | % Weight |
|---|---|
| Portfolio A | 5.00% |
| Portfolio B | 3.50% |
| Portfolio C | 2.25% |
Excel Add-In Codes
| Name: =YCI("M:CHDVX", "name") |
| Broad Asset Class: =YCI("M:CHDVX", "broad_asset_class") |
| Broad Category: =YCI("M:CHDVX", "broad_category_group") |
| Prospectus Objective: =YCI("M:CHDVX", "prospectus_objective") |
| To find the codes for any of our securities and financial metrics, see our Complete Excel Reference. |