

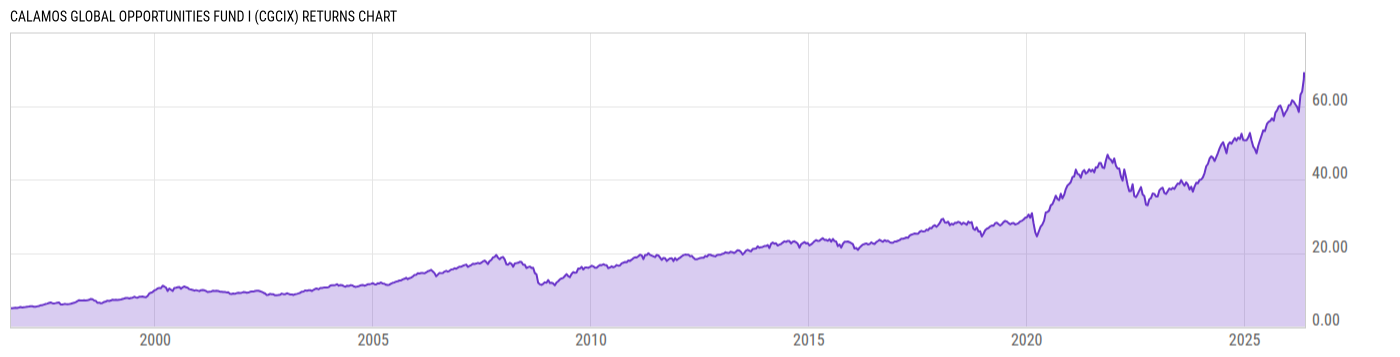
Calamos Global Opportunities Fund I (CGCIX)
15.73
+0.03
(+0.19%)
USD |
May 22 2026
Returns Chart
Key Stats
| Net Expense Ratio | Total Assets Under Management | Weighted Average Dividend Yield | Turnover Ratio (Generic) |
|---|---|---|---|
| 0.97% | 314.27M | 1.08% | 123.0% |
| 1 Year Fund Level Flows | 1 Year Total Returns (Daily) | Annualized Total Returns Since Inception (Daily) | Max Drawdown (Since Inception) |
| 1.519M | 30.76% |
Basic Info
| Investment Strategy | |
| The Fund seeks high long-term total return through capital appreciation and current income. The Fund invests primarily in a globally diversified portfolio of convertible, equity, and fixed-income securities, which may include synthetic convertible instruments, without regard to market capitalization. |
| General | |
| Security Type | Mutual Fund |
| Equity Style | Large Cap Growth |
| Broad Asset Class | Allocation |
| Broad Category | Allocation |
| Global Peer Group | Mixed Asset USD Flexible - Global |
| Peer Group | Flexible Portfolio Funds |
| Global Macro | Mixed Asset HC Flexible |
| US Macro | Mixed-Assets Funds |
| YCharts Categorization | -- |
| YCharts Benchmark | -- |
| Prospectus Objective | Flexible Portfolio Funds |
| Fund Owner Firm Name | Calamos |
| Broad Asset Class Benchmark Index | |
| ^SPXTR | 100.0% |
Net Fund Flows Versus Peer Group
1 Month
% Rank:
24
-159.25M
Peer Group Low
4.890B
Peer Group High
1 Year
% Rank:
31
1.519M
-3.214B
Peer Group Low
4.890B
Peer Group High
3 Months
% Rank:
25
-582.29M
Peer Group Low
4.890B
Peer Group High
3 Years
% Rank:
32
-12.12B
Peer Group Low
4.890B
Peer Group High
6 Months
% Rank:
23
-1.396B
Peer Group Low
4.890B
Peer Group High
5 Years
% Rank:
34
-14.74B
Peer Group Low
4.971B
Peer Group High
YTD
% Rank:
28
-927.39M
Peer Group Low
4.890B
Peer Group High
10 Years
% Rank:
67
-47.38B
Peer Group Low
9.619B
Peer Group High
Date Unavailable
Risk
Performance Versus Peer Group
Annual Total Returns Versus Peers
As of May 23, 2026.
Asset Allocation
As of February 28, 2026.
| Type | % Net |
|---|---|
| Cash | 0.93% |
| Stock | 66.25% |
| Bond | 26.34% |
| Convertible | 0.00% |
| Preferred | 3.21% |
| Other | 3.26% |
Top 10 Holdings
| Name | % Weight | Price | % Change |
|---|---|---|---|
| NVIDIA Corp. | 5.08% | 215.33 | -1.90% |
| Alphabet, Inc. | 4.34% | 382.97 | -1.21% |
| Taiwan Semiconductor Manufacturing Co., Ltd. | 4.16% | 17.24 | 0.00% |
| Samsung Electronics Co., Ltd. | 3.69% | 140.00 | 0.00% |
| THE BOEING COMPANY BA 6.0 10/15/2027 FIX USD Corporate | 3.21% | 69.96 | -4.06% |
|
Iberdrola Finanzas SAU 1.5% 27-MAR-2030
|
2.30% | -- | -- |
| Eli Lilly & Co. | 1.89% | 1065.00 | 2.24% |
| Alibaba Group Holding Limited ALIBGRO 0.0 09/15/2032 FIX USD Corporate RegS | 1.85% | 97.75 | 0.38% |
| GE Vernova, Inc. | 1.78% | 1038.74 | -0.49% |
| ASML Holding NV | 1.73% | 1645.20 | 3.67% |
Fees & Availability
| Fees | |
| Actual 12B-1 Fee | -- |
| Actual Management Fee | 0.77% |
| Administration Fee | -- |
| Maximum Front Load | -- |
| Maximum Deferred Load | -- |
| Maximum Redemption Fee | 0.00% |
| General Availability | |
| Available for Insurance Product | No |
| Available for RRSP | No |
| Purchase Details | |
| Open to New Investors |
|
| Minimum Initial Investment | 1.00M None |
| Minimum Subsequent Investment | 0.00 None |
Basic Info
| Investment Strategy | |
| The Fund seeks high long-term total return through capital appreciation and current income. The Fund invests primarily in a globally diversified portfolio of convertible, equity, and fixed-income securities, which may include synthetic convertible instruments, without regard to market capitalization. |
| General | |
| Security Type | Mutual Fund |
| Equity Style | Large Cap Growth |
| Broad Asset Class | Allocation |
| Broad Category | Allocation |
| Global Peer Group | Mixed Asset USD Flexible - Global |
| Peer Group | Flexible Portfolio Funds |
| Global Macro | Mixed Asset HC Flexible |
| US Macro | Mixed-Assets Funds |
| YCharts Categorization | -- |
| YCharts Benchmark | -- |
| Prospectus Objective | Flexible Portfolio Funds |
| Fund Owner Firm Name | Calamos |
| Broad Asset Class Benchmark Index | |
| ^SPXTR | 100.0% |
Fundamentals
| General | |
| Distribution Yield | -- |
| Dividend Yield TTM (5-22-26) | 0.43% |
| 30-Day SEC Yield | -- |
| 7-Day SEC Yield | -- |
| Number of Holdings | 103 |
| Stock | |
| Weighted Average PE Ratio | 31.00 |
| Weighted Average Price to Sales Ratio | 9.073 |
| Weighted Average Price to Book Ratio | 9.882 |
| Weighted Median ROE | 145.3% |
| Weighted Median ROA | 16.00% |
| ROI (TTM) | 23.02% |
| Return on Investment (TTM) | 23.02% |
| Earning Yield | 0.0397 |
| LT Debt / Shareholders Equity | 0.5561 |
| Number of Equity Holdings | 57 |
| Bond | |
| Yield to Maturity (2-28-26) | -3.69% |
| Effective Duration | 1.50 |
| Average Coupon | 1.98% |
| Calculated Average Quality | 3.821 |
| Effective Maturity | 4.386 |
| Nominal Maturity | 4.386 |
| Number of Bond Holdings | 28 |
As of February 28, 2026
Growth Metrics
| EPS Growth (1Y) | 40.75% |
| EPS Growth (3Y) | 31.78% |
| EPS Growth (5Y) | 30.12% |
| Sales Growth (1Y) | 17.86% |
| Sales Growth (3Y) | 18.79% |
| Sales Growth (5Y) | 16.92% |
| Sales per Share Growth (1Y) | 19.25% |
| Sales per Share Growth (3Y) | 19.57% |
| Operating Cash Flow - Growth Rate (3Y) | 33.15% |
As of February 28, 2026
Top Portfolio Holders
| Name | % Weight |
|---|---|
| Portfolio A | 5.00% |
| Portfolio B | 3.50% |
| Portfolio C | 2.25% |
Excel Add-In Codes
| Name: =YCI("M:CGCIX", "name") |
| Broad Asset Class: =YCI("M:CGCIX", "broad_asset_class") |
| Broad Category: =YCI("M:CGCIX", "broad_category_group") |
| Prospectus Objective: =YCI("M:CGCIX", "prospectus_objective") |
| To find the codes for any of our securities and financial metrics, see our Complete Excel Reference. |