

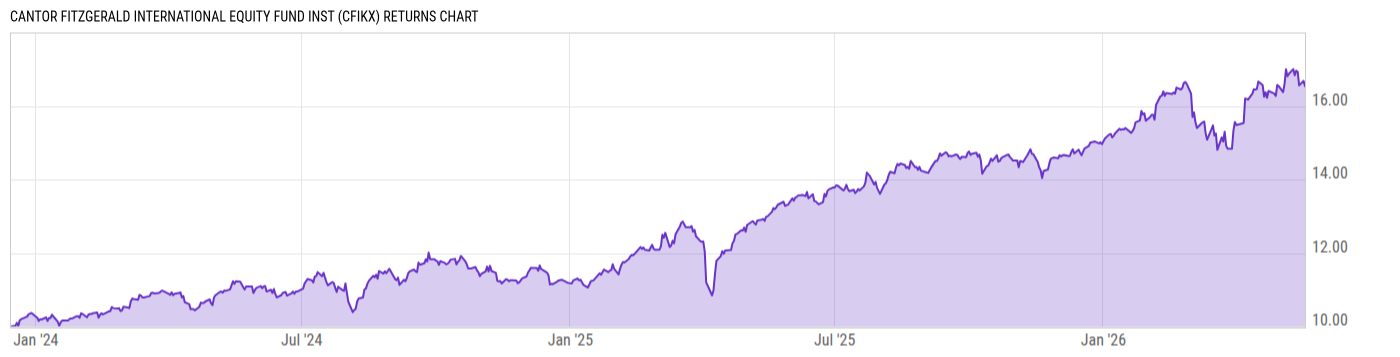
Cantor Fitzgerald International Equity Fund Inst (CFIKX)
16.36
+0.04
(+0.25%)
USD |
Jun 09 2026
Returns Chart
Key Stats
| Net Expense Ratio | Total Assets Under Management | Weighted Average Dividend Yield | Turnover Ratio (Generic) |
|---|---|---|---|
| 1.01% | 97.77M | 2.76% | 87.00% |
| 1 Year Fund Level Flows | 1 Year Total Returns (Daily) | Annualized Total Returns Since Inception (Daily) | Max Drawdown (Since Inception) |
| 65.23M | 23.55% |
Basic Info
| Investment Strategy | |
| The Fund seeks long-term growth of capital. Normally, the Fund will primarily invest its net assets in equity and equity-related securities of companies located in at least ten countries outside the US, including in emerging market countries that believes offers the best potential for unexpected earnings growth. |
| General | |
| Security Type | Mutual Fund |
| Equity Style | Large Cap Core |
| Broad Asset Class | International Equity |
| Broad Category | Equity |
| Global Peer Group | Equity Global ex US |
| Peer Group | International Large-Cap Value |
| Global Macro | Equity Global |
| US Macro | Developed International Markets Funds |
| YCharts Categorization | -- |
| YCharts Benchmark | -- |
| Prospectus Objective | International Funds |
| Fund Owner Firm Name | Cantor Fitzgerald |
| Broad Asset Class Benchmark Index | |
| ^MSACXUSNTR | 100.0% |
Net Fund Flows Versus Peer Group
1 Month
% Rank:
36
-315.71M
Peer Group Low
342.07M
Peer Group High
1 Year
% Rank:
31
65.23M
-3.989B
Peer Group Low
2.902B
Peer Group High
3 Months
% Rank:
34
-1.270B
Peer Group Low
989.53M
Peer Group High
3 Years
% Rank:
40
-7.227B
Peer Group Low
5.650B
Peer Group High
6 Months
% Rank:
23
-2.475B
Peer Group Low
1.971B
Peer Group High
5 Years
% Rank:
37
-6.923B
Peer Group Low
6.664B
Peer Group High
YTD
% Rank:
35
-1.257B
Peer Group Low
1.824B
Peer Group High
10 Years
% Rank:
44
-36.93B
Peer Group Low
11.31B
Peer Group High
Date Unavailable
Risk
Performance Versus Peer Group
Annual Total Returns Versus Peers
As of June 10, 2026.
Asset Allocation
As of March 31, 2026.
| Type | % Net |
|---|---|
| Cash | 1.22% |
| Stock | 97.15% |
| Bond | 1.38% |
| Convertible | 0.00% |
| Preferred | 0.02% |
| Other | 0.23% |
Top 10 Holdings
| Name | % Weight | Price | % Change |
|---|---|---|---|
| Taiwan Semiconductor Manufacturing Co., Ltd. | 4.49% | 427.87 | 0.25% |
|
SK Hynix Inc ORD
|
4.18% | -- | -- |
| Siemens Energy AG | 3.04% | 179.33 | -0.62% |
| Banco Santander SA | 2.99% | 12.60 | 0.24% |
| Canadian Imperial Bank of Commerce | 2.98% | 110.75 | 1.12% |
| Asia Vital Components Co., Ltd. | 2.95% | 21.88 | 0.00% |
| Rolls-Royce Holdings Plc | 2.85% | 16.72 | 0.14% |
| Kinross Gold Corp. | 2.75% | 35.20 | -2.36% |
|
KB Financial Group Inc ORD
|
2.74% | -- | -- |
| Intesa Sanpaolo SpA | 2.73% | 6.36 | -2.75% |
Fees & Availability
| Fees | |
| Actual 12B-1 Fee | -- |
| Actual Management Fee | -- |
| Administration Fee | 19.65K% |
| Maximum Front Load | -- |
| Maximum Deferred Load | -- |
| Maximum Redemption Fee | -- |
| General Availability | |
| Available for Insurance Product | No |
| Available for RRSP | No |
| Purchase Details | |
| Open to New Investors |
|
| Minimum Initial Investment | 0.00 None |
| Minimum Subsequent Investment | 0.00 None |
Basic Info
| Investment Strategy | |
| The Fund seeks long-term growth of capital. Normally, the Fund will primarily invest its net assets in equity and equity-related securities of companies located in at least ten countries outside the US, including in emerging market countries that believes offers the best potential for unexpected earnings growth. |
| General | |
| Security Type | Mutual Fund |
| Equity Style | Large Cap Core |
| Broad Asset Class | International Equity |
| Broad Category | Equity |
| Global Peer Group | Equity Global ex US |
| Peer Group | International Large-Cap Value |
| Global Macro | Equity Global |
| US Macro | Developed International Markets Funds |
| YCharts Categorization | -- |
| YCharts Benchmark | -- |
| Prospectus Objective | International Funds |
| Fund Owner Firm Name | Cantor Fitzgerald |
| Broad Asset Class Benchmark Index | |
| ^MSACXUSNTR | 100.0% |
Fundamentals
| General | |
| Distribution Yield | -- |
| Dividend Yield TTM (6-8-26) | 0.53% |
| 30-Day SEC Yield | -- |
| 7-Day SEC Yield | -- |
| Number of Holdings | 44 |
| Stock | |
| Weighted Average PE Ratio | 20.68 |
| Weighted Average Price to Sales Ratio | 3.422 |
| Weighted Average Price to Book Ratio | 4.367 |
| Weighted Median ROE | 35.26% |
| Weighted Median ROA | 7.05% |
| ROI (TTM) | 14.40% |
| Return on Investment (TTM) | 14.40% |
| Earning Yield | 0.0616 |
| LT Debt / Shareholders Equity | 0.6934 |
| Number of Equity Holdings | 40 |
As of March 31, 2026
Growth Metrics
| EPS Growth (1Y) | 27.28% |
| EPS Growth (3Y) | 17.91% |
| EPS Growth (5Y) | 19.26% |
| Sales Growth (1Y) | 12.64% |
| Sales Growth (3Y) | 8.83% |
| Sales Growth (5Y) | 9.44% |
| Sales per Share Growth (1Y) | 14.54% |
| Sales per Share Growth (3Y) | 9.58% |
| Operating Cash Flow - Growth Rate (3Y) | 17.43% |
As of March 31, 2026
Fund Details
Top Portfolio Holders
| Name | % Weight |
|---|---|
| Portfolio A | 5.00% |
| Portfolio B | 3.50% |
| Portfolio C | 2.25% |
Excel Add-In Codes
| Name: =YCI("M:CFIKX", "name") |
| Broad Asset Class: =YCI("M:CFIKX", "broad_asset_class") |
| Broad Category: =YCI("M:CFIKX", "broad_category_group") |
| Prospectus Objective: =YCI("M:CFIKX", "prospectus_objective") |
| To find the codes for any of our securities and financial metrics, see our Complete Excel Reference. |