

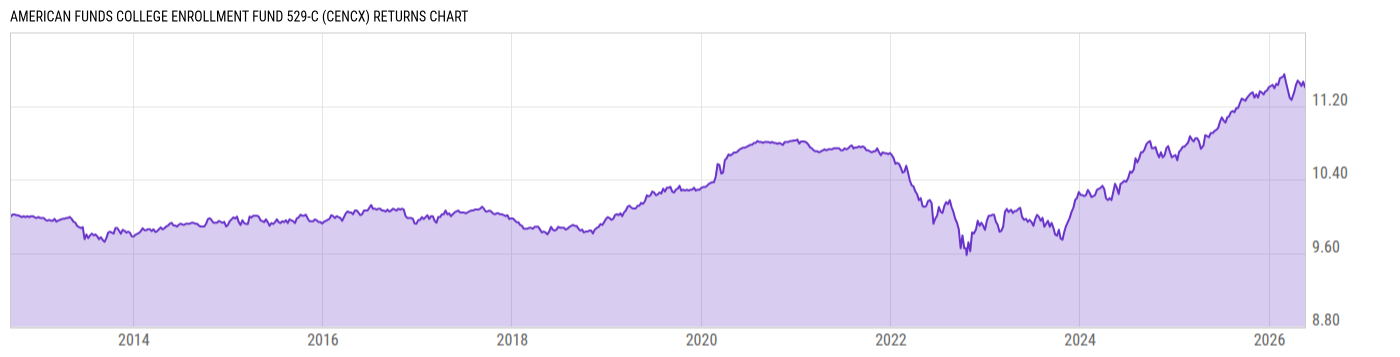
American Funds College Enrollment Fund 529-C (CENCX)
9.77
0.00 (0.00%)
USD |
Jun 08 2026
Returns Chart
Key Stats
| Net Expense Ratio | Total Assets Under Management | Weighted Average Dividend Yield | Turnover Ratio (Generic) |
|---|---|---|---|
| 1.43% | 3.190B | -- | 10.00% |
| 1 Year Fund Level Flows | 1 Year Total Returns (Daily) | Annualized Total Returns Since Inception (Daily) | Max Drawdown (Since Inception) |
| -770.69M | 4.70% |
Basic Info
| Investment Strategy | |
| The Fund seeks current income, consistent with preservation of capital. The Fund will invest in funds that seek current income in American Funds through bond investments or in other fixed income instruments. The fund may invest in growth-and-income funds, equity-income funds and balanced funds to a limited extent. |
| General | |
| Security Type | Mutual Fund |
| Equity Style | -- |
| Broad Asset Class | Taxable Bond |
| Broad Category | Fixed Income |
| Global Peer Group | Bond USD Medium Term |
| Peer Group | Short-Intmdt Investment Grade Debt Funds |
| Global Macro | Bond HC |
| US Macro | Short/Intermediate Investment-Grade Funds |
| YCharts Categorization | -- |
| YCharts Benchmark | -- |
| Prospectus Objective | Short-Intmdt Investment Grade Debt Funds |
| Fund Owner Firm Name | Capital Group/American Funds |
| Broad Asset Class Benchmark Index | |
| ^BBUSATR | 100.0% |
Net Fund Flows Versus Peer Group
1 Month
% Rank:
89
-110.70M
Peer Group Low
1.061B
Peer Group High
1 Year
% Rank:
99
-770.69M
-2.092B
Peer Group Low
8.621B
Peer Group High
3 Months
% Rank:
94
-523.74M
Peer Group Low
2.753B
Peer Group High
3 Years
% Rank:
94
-5.429B
Peer Group Low
5.912B
Peer Group High
6 Months
% Rank:
99
-1.373B
Peer Group Low
3.932B
Peer Group High
5 Years
% Rank:
80
-6.085B
Peer Group Low
6.014B
Peer Group High
YTD
% Rank:
95
-470.42M
Peer Group Low
3.804B
Peer Group High
10 Years
% Rank:
99
-3.652B
Peer Group Low
35.57B
Peer Group High
Date Unavailable
Risk
Performance Versus Peer Group
Annual Total Returns Versus Peers
As of June 09, 2026.
Asset Allocation
As of March 31, 2026.
| Type | % Net |
|---|---|
| Cash | 7.03% |
| Stock | 11.52% |
| Bond | 80.62% |
| Convertible | 0.00% |
| Preferred | 0.06% |
| Other | 0.78% |
Top 7 Holdings
| Name | % Weight | Price | % Change |
|---|---|---|---|
| American Funds Short-Term Bd Fd of America R6 | 40.25% | 9.50 | 0.00% |
| American Funds Intmdt Bond Fund of America R6 | 31.24% | 12.50 | 0.00% |
| American Funds Mortgage Fund R6 | 10.08% | 8.73 | 0.00% |
| American Funds American Mutual Fund R6 | 8.64% | 62.61 | -0.14% |
| American Funds Strategic Bond Fund R6 | 4.99% | 9.12 | -0.11% |
| American Funds American Balanced Fund R6 | 4.84% | 40.28 | 0.30% |
|
Other Assets less Liabilities
|
-0.04% | -- | -- |
Fees & Availability
| Fees | |
| Actual 12B-1 Fee | 1.00% |
| Actual Management Fee | 0.00% |
| Administration Fee | -- |
| Maximum Front Load | -- |
| Maximum Deferred Load | 1.00% |
| Maximum Redemption Fee | -- |
| General Availability | |
| Available for Insurance Product | No |
| Available for RRSP | No |
| Purchase Details | |
| Open to New Investors |
|
| Minimum Initial Investment | 250.00 None |
| Minimum Subsequent Investment | 50.00 None |
Basic Info
| Investment Strategy | |
| The Fund seeks current income, consistent with preservation of capital. The Fund will invest in funds that seek current income in American Funds through bond investments or in other fixed income instruments. The fund may invest in growth-and-income funds, equity-income funds and balanced funds to a limited extent. |
| General | |
| Security Type | Mutual Fund |
| Equity Style | -- |
| Broad Asset Class | Taxable Bond |
| Broad Category | Fixed Income |
| Global Peer Group | Bond USD Medium Term |
| Peer Group | Short-Intmdt Investment Grade Debt Funds |
| Global Macro | Bond HC |
| US Macro | Short/Intermediate Investment-Grade Funds |
| YCharts Categorization | -- |
| YCharts Benchmark | -- |
| Prospectus Objective | Short-Intmdt Investment Grade Debt Funds |
| Fund Owner Firm Name | Capital Group/American Funds |
| Broad Asset Class Benchmark Index | |
| ^BBUSATR | 100.0% |
Fundamentals
| General | |
| Distribution Yield | -- |
| Dividend Yield TTM (6-5-26) | 2.86% |
| 30-Day SEC Yield (4-30-26) | 2.67% |
| 7-Day SEC Yield | -- |
| Number of Holdings | 7 |
| Stock | |
| Weighted Average PE Ratio | -- |
| Weighted Average Price to Sales Ratio | -- |
| Weighted Average Price to Book Ratio | -- |
| Weighted Median ROE | -- |
| Weighted Median ROA | -- |
| ROI (TTM) | -- |
| Return on Investment (TTM) | -- |
| Earning Yield | -- |
| LT Debt / Shareholders Equity | -- |
| Number of Equity Holdings | 0 |
| Bond | |
| Yield to Maturity (3-31-26) | 4.08% |
| Effective Duration | 4.10 |
| Average Coupon | 4.25% |
| Calculated Average Quality | 1.937 |
| Effective Maturity | 12.29 |
| Nominal Maturity | 12.29 |
| Number of Bond Holdings | 0 |
As of March 31, 2026
Growth Metrics
| EPS Growth (1Y) | -- |
| EPS Growth (3Y) | -- |
| EPS Growth (5Y) | -- |
| Sales Growth (1Y) | -- |
| Sales Growth (3Y) | -- |
| Sales Growth (5Y) | -- |
| Sales per Share Growth (1Y) | -- |
| Sales per Share Growth (3Y) | -- |
| Operating Cash Flow - Growth Rate (3Y) | -- |
As of March 31, 2026
Fund Details
| Key Dates | |
| Inception Date | 9/14/2012 |
| Last Annual Report Date | 10/31/2025 |
| Last Prospectus Date | 1/1/2026 |
| Share Classes | |
| CENAX | 529 Plans |
| CENEX | 529 Plans |
| CENFX | 529 Plans |
| FAADX | 529 Plans |
| FTAOX | 529 Plans |
| Attributes | |
| Index Fund | -- |
| Inverse Fund | No |
| Leveraged Fund | -- |
| Fund of Funds |
|
| Currency Hedged Fund | -- |
| Socially Responsible Fund | No |
Top Portfolio Holders
| Name | % Weight |
|---|---|
| Portfolio A | 5.00% |
| Portfolio B | 3.50% |
| Portfolio C | 2.25% |
Excel Add-In Codes
| Name: =YCI("M:CENCX", "name") |
| Broad Asset Class: =YCI("M:CENCX", "broad_asset_class") |
| Broad Category: =YCI("M:CENCX", "broad_category_group") |
| Prospectus Objective: =YCI("M:CENCX", "prospectus_objective") |
| To find the codes for any of our securities and financial metrics, see our Complete Excel Reference. |