

Columbia Multi-Manager Dir Alt Strat Fd I (CDAZX)
7.52
0.00 (0.00%)
USD |
May 27 2026
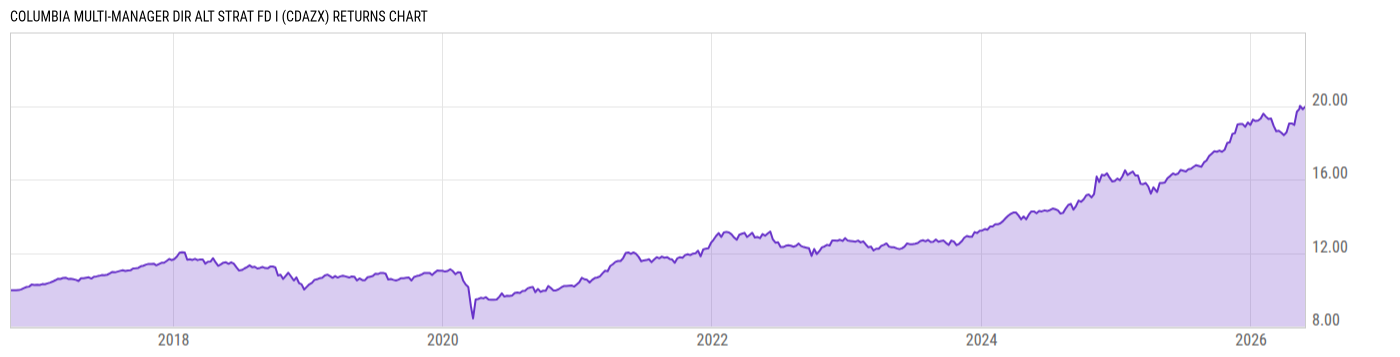
Returns Chart
Key Stats
| Net Expense Ratio | Total Assets Under Management | Weighted Average Dividend Yield | Turnover Ratio (Generic) |
|---|---|---|---|
| 2.42% | 326.72M | -- | 344.0% |
| 1 Year Fund Level Flows | 1 Year Total Returns (Daily) | Annualized Total Returns Since Inception (Daily) | Max Drawdown (Since Inception) |
| -6.864M | 23.18% |
Basic Info
| Investment Strategy | |
| The Fund seeks capital appreciation by allocating its assets among different asset managers that employ various investment styles and strategies by participating in broad equity markets while hedging overall market exposure. Generally, the Fund seeks to provide higher risk-adjusted returns with lower volatility. |
| General | |
| Security Type | Mutual Fund |
| Equity Style | -- |
| Broad Asset Class | Alternative |
| Broad Category | Alternative Strategies |
| Global Peer Group | Alternative Multi Strategies |
| Peer Group | Alternative Multi-Strategy Funds |
| Global Macro | Liquid Alternatives |
| US Macro | Alternative Equity Funds |
| YCharts Categorization | -- |
| YCharts Benchmark | -- |
| Prospectus Objective | Alternative Multi-Strategy Funds |
| Fund Owner Firm Name | Columbia Threadneedle Investments |
| Broad Asset Class Benchmark Index | |
| ^MSACWINTR | 100.0% |
Net Fund Flows Versus Peer Group
1 Month
% Rank:
69
-57.14M
Peer Group Low
449.76M
Peer Group High
1 Year
% Rank:
53
-6.864M
-552.08M
Peer Group Low
4.649B
Peer Group High
3 Months
% Rank:
16
-220.49M
Peer Group Low
1.193B
Peer Group High
3 Years
% Rank:
55
-1.806B
Peer Group Low
6.229B
Peer Group High
6 Months
% Rank:
65
-247.22M
Peer Group Low
2.749B
Peer Group High
5 Years
% Rank:
65
-2.319B
Peer Group Low
6.492B
Peer Group High
YTD
% Rank:
25
-183.82M
Peer Group Low
2.170B
Peer Group High
10 Years
% Rank:
62
-3.287B
Peer Group Low
6.881B
Peer Group High
Date Unavailable
Risk
Performance Versus Peer Group
Annual Total Returns Versus Peers
As of May 28, 2026.
Asset Allocation
As of March 31, 2026.
| Type | % Net |
|---|---|
| Cash | 6.50% |
| Stock | 46.33% |
| Bond | -0.00% |
| Convertible | 0.00% |
| Preferred | 0.00% |
| Other | 47.17% |
Top 10 Holdings
| Name | % Weight | Price | % Change |
|---|---|---|---|
|
Other Assets less Liabilities
|
46.32% | -- | -- |
|
Columbia Short-Term Cash Fund
|
6.50% | -- | -- |
| Tower Semiconductor Ltd. | 2.19% | 277.79 | -3.72% |
| Akamai Technologies, Inc. | 1.60% | 144.43 | -2.55% |
| Natera, Inc. | 1.35% | 203.11 | 1.10% |
| Silicon Motion Technology Corp. | 1.24% | 284.98 | -1.84% |
| NRG Energy, Inc. | 1.20% | 138.00 | -1.73% |
| Lattice Semiconductor Corp. | 0.96% | 147.91 | -1.62% |
| NVIDIA Corp. | 0.94% | 212.60 | -1.05% |
| Nebius Group NV | 0.90% | 208.37 | 0.15% |
Fees & Availability
| Fees | |
| Actual 12B-1 Fee | -- |
| Actual Management Fee | 1.47% |
| Administration Fee | -- |
| Maximum Front Load | -- |
| Maximum Deferred Load | -- |
| Maximum Redemption Fee | -- |
| General Availability | |
| Available for Insurance Product | No |
| Available for RRSP | No |
| Purchase Details | |
| Open to New Investors |
|
| Minimum Initial Investment | 2000.00 None |
| Minimum Subsequent Investment | 0.00 None |
Basic Info
| Investment Strategy | |
| The Fund seeks capital appreciation by allocating its assets among different asset managers that employ various investment styles and strategies by participating in broad equity markets while hedging overall market exposure. Generally, the Fund seeks to provide higher risk-adjusted returns with lower volatility. |
| General | |
| Security Type | Mutual Fund |
| Equity Style | -- |
| Broad Asset Class | Alternative |
| Broad Category | Alternative Strategies |
| Global Peer Group | Alternative Multi Strategies |
| Peer Group | Alternative Multi-Strategy Funds |
| Global Macro | Liquid Alternatives |
| US Macro | Alternative Equity Funds |
| YCharts Categorization | -- |
| YCharts Benchmark | -- |
| Prospectus Objective | Alternative Multi-Strategy Funds |
| Fund Owner Firm Name | Columbia Threadneedle Investments |
| Broad Asset Class Benchmark Index | |
| ^MSACWINTR | 100.0% |
Fundamentals
| General | |
| Distribution Yield | -- |
| Dividend Yield TTM (5-26-26) | 13.74% |
| 30-Day SEC Yield | -- |
| 7-Day SEC Yield | -- |
| Number of Holdings | 665 |
Fund Details
| Key Dates | |
| Inception Date | 10/17/2016 |
| Last Annual Report Date | 4/30/2025 |
| Last Prospectus Date | 9/1/2025 |
| Attributes | |
| Index Fund | -- |
| Inverse Fund | No |
| Leveraged Fund | -- |
| Fund of Funds | No |
| Currency Hedged Fund | -- |
| Socially Responsible Fund | No |
Top Portfolio Holders
| Name | % Weight |
|---|---|
| Portfolio A | 5.00% |
| Portfolio B | 3.50% |
| Portfolio C | 2.25% |
Excel Add-In Codes
| Name: =YCI("M:CDAZX", "name") |
| Broad Asset Class: =YCI("M:CDAZX", "broad_asset_class") |
| Broad Category: =YCI("M:CDAZX", "broad_category_group") |
| Prospectus Objective: =YCI("M:CDAZX", "prospectus_objective") |
| To find the codes for any of our securities and financial metrics, see our Complete Excel Reference. |