

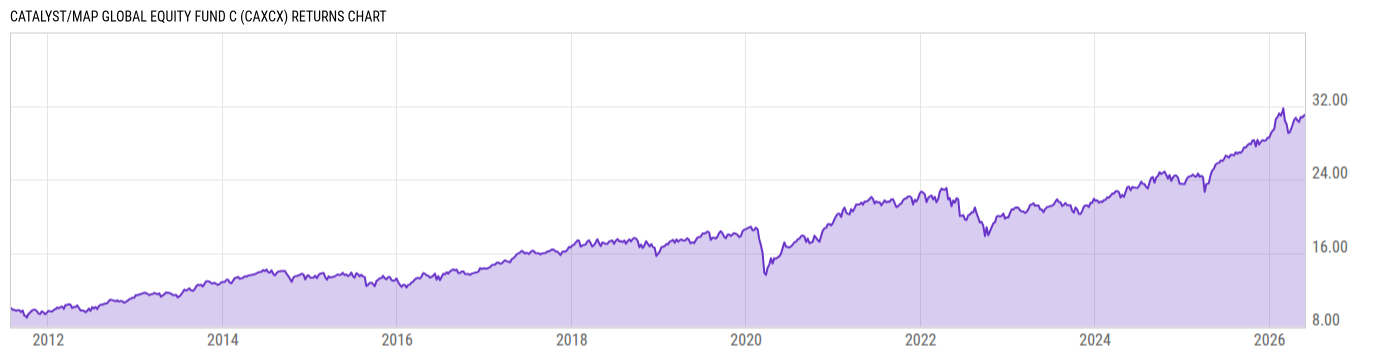
Catalyst/MAP Global Equity Fund C (CAXCX)
20.47
-0.03
(-0.15%)
USD |
May 29 2026
Returns Chart
Key Stats
| Net Expense Ratio | Total Assets Under Management | Weighted Average Dividend Yield | Turnover Ratio (Generic) |
|---|---|---|---|
| 1.97% | 94.61M | 2.23% | 30.00% |
| 1 Year Fund Level Flows | 1 Year Total Returns (Daily) | Annualized Total Returns Since Inception (Daily) | Max Drawdown (Since Inception) |
| -1.291M | 20.75% |
Basic Info
| Investment Strategy | |
| The Fund seeks long-term capital appreciation. The Fund primarily invests in equity securities of U.S. and foreign issuers. The Fund may invest in any market capitalization. The Fund seeks to invest in attractively valued securities that represent above-average long-term investment opportunities. |
| General | |
| Security Type | Mutual Fund |
| Equity Style | Multi Cap Value |
| Broad Asset Class | International Equity |
| Broad Category | Equity |
| Global Peer Group | Equity Global |
| Peer Group | Global Multi-Cap Value |
| Global Macro | Equity Global |
| US Macro | Developed Global Markets Funds |
| YCharts Categorization | -- |
| YCharts Benchmark | -- |
| Prospectus Objective | Global Funds |
| Fund Owner Firm Name | Catalyst Funds |
| Broad Asset Class Benchmark Index | |
| ^MSACXUSNTR | 100.0% |
Net Fund Flows Versus Peer Group
1 Month
% Rank:
20
-63.02M
Peer Group Low
14.19M
Peer Group High
1 Year
% Rank:
34
-1.291M
-658.50M
Peer Group Low
1.025B
Peer Group High
3 Months
% Rank:
27
-192.70M
Peer Group Low
151.28M
Peer Group High
3 Years
% Rank:
33
-2.611B
Peer Group Low
864.72M
Peer Group High
6 Months
% Rank:
40
-312.39M
Peer Group Low
746.78M
Peer Group High
5 Years
% Rank:
34
-3.515B
Peer Group Low
1.252B
Peer Group High
YTD
% Rank:
37
-232.16M
Peer Group Low
542.78M
Peer Group High
10 Years
% Rank:
42
-11.33B
Peer Group Low
1.519B
Peer Group High
Date Unavailable
Risk
Performance Versus Peer Group
Annual Total Returns Versus Peers
As of May 31, 2026.
Asset Allocation
As of December 31, 2025.
| Type | % Net |
|---|---|
| Cash | 0.14% |
| Stock | 92.83% |
| Bond | 0.11% |
| Convertible | 0.00% |
| Preferred | 1.97% |
| Other | 4.94% |
Top 10 Holdings
| Name | % Weight | Price | % Change |
|---|---|---|---|
| SPDR Gold MiniShares Trust | 4.84% | 89.93 | 1.08% |
| Cisco Systems, Inc. | 4.04% | 120.42 | 1.50% |
| Microsoft Corp. | 4.03% | 450.24 | 5.45% |
| Sanofi | 3.63% | 43.67 | -1.40% |
| Novartis AG | 3.55% | 150.17 | -0.81% |
| Nestlé SA | 3.41% | 101.44 | -0.49% |
| Medtronic Plc | 3.11% | 73.81 | -2.33% |
| Takeda Pharmaceutical Co., Ltd. | 3.08% | 15.96 | -1.18% |
| Alphabet, Inc. | 2.98% | 376.43 | -2.51% |
| Chevron Corp. | 2.98% | 182.46 | -0.31% |
Fees & Availability
| Fees | |
| Actual 12B-1 Fee | 1.00% |
| Actual Management Fee | 0.60% |
| Administration Fee | 5.46K% |
| Maximum Front Load | -- |
| Maximum Deferred Load | 0.00% |
| Maximum Redemption Fee | -- |
| General Availability | |
| Available for Insurance Product | No |
| Available for RRSP | No |
| Purchase Details | |
| Open to New Investors |
|
| Minimum Initial Investment | 2500.00 None |
| Minimum Subsequent Investment | 50.00 None |
Basic Info
| Investment Strategy | |
| The Fund seeks long-term capital appreciation. The Fund primarily invests in equity securities of U.S. and foreign issuers. The Fund may invest in any market capitalization. The Fund seeks to invest in attractively valued securities that represent above-average long-term investment opportunities. |
| General | |
| Security Type | Mutual Fund |
| Equity Style | Multi Cap Value |
| Broad Asset Class | International Equity |
| Broad Category | Equity |
| Global Peer Group | Equity Global |
| Peer Group | Global Multi-Cap Value |
| Global Macro | Equity Global |
| US Macro | Developed Global Markets Funds |
| YCharts Categorization | -- |
| YCharts Benchmark | -- |
| Prospectus Objective | Global Funds |
| Fund Owner Firm Name | Catalyst Funds |
| Broad Asset Class Benchmark Index | |
| ^MSACXUSNTR | 100.0% |
Fundamentals
| General | |
| Distribution Yield | -- |
| Dividend Yield TTM (5-28-26) | 0.25% |
| 30-Day SEC Yield | -- |
| 7-Day SEC Yield | -- |
| Number of Holdings | 54 |
| Stock | |
| Weighted Average PE Ratio | 26.53 |
| Weighted Average Price to Sales Ratio | 4.143 |
| Weighted Average Price to Book Ratio | 4.982 |
| Weighted Median ROE | 21.96% |
| Weighted Median ROA | 9.29% |
| ROI (TTM) | 12.38% |
| Return on Investment (TTM) | 12.38% |
| Earning Yield | 0.0501 |
| LT Debt / Shareholders Equity | 0.5962 |
| Number of Equity Holdings | 51 |
As of December 31, 2025
Growth Metrics
| EPS Growth (1Y) | 12.11% |
| EPS Growth (3Y) | 3.73% |
| EPS Growth (5Y) | 12.16% |
| Sales Growth (1Y) | 7.71% |
| Sales Growth (3Y) | 4.87% |
| Sales Growth (5Y) | 5.56% |
| Sales per Share Growth (1Y) | 20.36% |
| Sales per Share Growth (3Y) | 6.71% |
| Operating Cash Flow - Growth Rate (3Y) | 7.31% |
As of December 31, 2025
Fund Details
Top Portfolio Holders
| Name | % Weight |
|---|---|
| Portfolio A | 5.00% |
| Portfolio B | 3.50% |
| Portfolio C | 2.25% |
Excel Add-In Codes
| Name: =YCI("M:CAXCX", "name") |
| Broad Asset Class: =YCI("M:CAXCX", "broad_asset_class") |
| Broad Category: =YCI("M:CAXCX", "broad_category_group") |
| Prospectus Objective: =YCI("M:CAXCX", "prospectus_objective") |
| To find the codes for any of our securities and financial metrics, see our Complete Excel Reference. |