

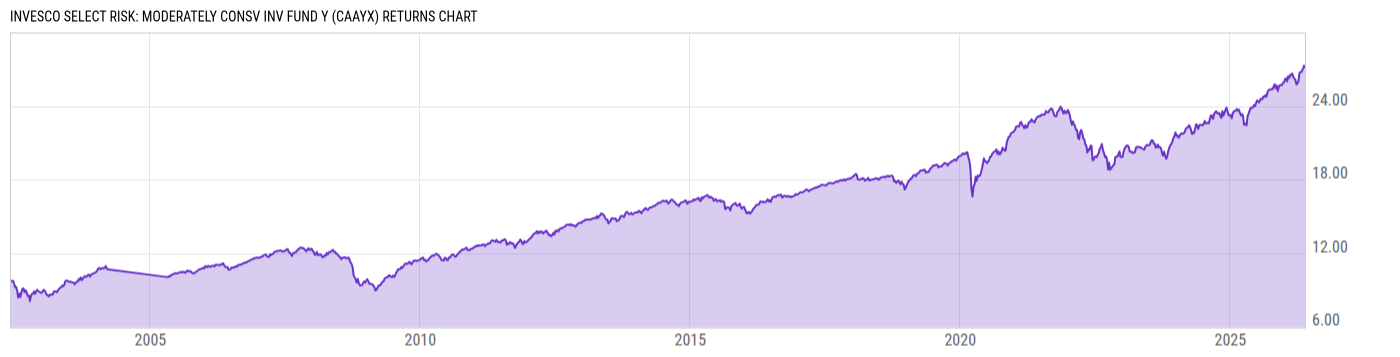
Invesco Select Risk: Moderately Consv Inv Fund Y (CAAYX)
12.14
+0.02
(+0.16%)
USD |
Jun 04 2026
Returns Chart
Key Stats
| Net Expense Ratio | Total Assets Under Management | Weighted Average Dividend Yield | Turnover Ratio (Generic) |
|---|---|---|---|
| 0.20% | 279.39M | -- | 27.00% |
| 1 Year Fund Level Flows | 1 Year Total Returns (Daily) | Annualized Total Returns Since Inception (Daily) | Max Drawdown (Since Inception) |
| -22.78M | 14.99% |
Basic Info
| Investment Strategy | |
| The Fund seeks total return consistent with a lower level of risk relative to the broad stock market. The Fund is a "fund of funds," that invests in assets in other underlying AIM mutual funds. The Fund's target allocation is to invest 60% of assets in fixed-income funds and 40% of its assets in equity funds. |
| General | |
| Security Type | Mutual Fund |
| Equity Style | -- |
| Broad Asset Class | Allocation |
| Broad Category | Allocation |
| Global Peer Group | Mixed Asset USD Conservative |
| Peer Group | Mixed-Asset Target Alloc Consv Funds |
| Global Macro | Mixed Asset HC Conservative |
| US Macro | Mixed-Assets Target Allocation Funds |
| YCharts Categorization | -- |
| YCharts Benchmark | -- |
| Prospectus Objective | Income Funds |
| Fund Owner Firm Name | Invesco |
| Broad Asset Class Benchmark Index | |
| ^SPXTR | 100.0% |
Net Fund Flows Versus Peer Group
1 Month
% Rank:
17
-413.63M
Peer Group Low
18.88M
Peer Group High
1 Year
% Rank:
45
-22.78M
-4.916B
Peer Group Low
619.48M
Peer Group High
3 Months
% Rank:
33
-1.064B
Peer Group Low
284.45M
Peer Group High
3 Years
% Rank:
44
-19.30B
Peer Group Low
597.52M
Peer Group High
6 Months
% Rank:
47
-2.423B
Peer Group Low
635.87M
Peer Group High
5 Years
% Rank:
40
-25.15B
Peer Group Low
585.71M
Peer Group High
YTD
% Rank:
45
-1.515B
Peer Group Low
637.42M
Peer Group High
10 Years
% Rank:
44
-24.14B
Peer Group Low
948.31M
Peer Group High
Date Unavailable
Risk
Performance Versus Peer Group
Annual Total Returns Versus Peers
As of June 05, 2026.
Asset Allocation
As of April 30, 2026.
| Type | % Net |
|---|---|
| Cash | -11.94% |
| Stock | 44.32% |
| Bond | 50.82% |
| Convertible | 0.00% |
| Preferred | 0.30% |
| Other | 16.50% |
Top 10 Holdings
| Name | % Weight | Price | % Change |
|---|---|---|---|
| Invesco Core Bond Fund R6 | 14.07% | 5.62 | 0.00% |
| Invesco Equal Weight 0-30 Year Treasury ETF | 9.90% | 27.04 | 0.20% |
| Invesco S&P 500 Revenue ETF | 8.91% | 128.28 | 1.25% |
|
10Y TNotes JUN26
|
8.19% | -- | -- |
| Invesco Core Plus Bond Fund R6 | 7.27% | 9.22 | 0.11% |
| Invesco Russell 1000 Dynamic Multifactor ETF | 6.46% | 68.93 | 0.57% |
| Invesco Global Fund R6 | 6.07% | 98.83 | 0.37% |
| Invesco Short Term Treasury ETF | 5.92% | 105.64 | 0.01% |
| Invesco NASDAQ 100 ETF | 5.21% | 304.94 | -0.54% |
| Invesco Managed Futures Strategy ETF | 4.48% | 52.53 | 0.21% |
Fees & Availability
| Fees | |
| Actual 12B-1 Fee | -- |
| Actual Management Fee | 0.00% |
| Administration Fee | -- |
| Maximum Front Load | -- |
| Maximum Deferred Load | -- |
| Maximum Redemption Fee | -- |
| General Availability | |
| Available for Insurance Product | No |
| Available for RRSP | No |
| Purchase Details | |
| Open to New Investors |
|
| Minimum Initial Investment | 1000.00 None |
| Minimum Subsequent Investment | 50.00 None |
Basic Info
| Investment Strategy | |
| The Fund seeks total return consistent with a lower level of risk relative to the broad stock market. The Fund is a "fund of funds," that invests in assets in other underlying AIM mutual funds. The Fund's target allocation is to invest 60% of assets in fixed-income funds and 40% of its assets in equity funds. |
| General | |
| Security Type | Mutual Fund |
| Equity Style | -- |
| Broad Asset Class | Allocation |
| Broad Category | Allocation |
| Global Peer Group | Mixed Asset USD Conservative |
| Peer Group | Mixed-Asset Target Alloc Consv Funds |
| Global Macro | Mixed Asset HC Conservative |
| US Macro | Mixed-Assets Target Allocation Funds |
| YCharts Categorization | -- |
| YCharts Benchmark | -- |
| Prospectus Objective | Income Funds |
| Fund Owner Firm Name | Invesco |
| Broad Asset Class Benchmark Index | |
| ^SPXTR | 100.0% |
Fundamentals
| General | |
| Distribution Yield | -- |
| Dividend Yield TTM (6-3-26) | 3.05% |
| 30-Day SEC Yield (4-30-26) | 2.91% |
| 7-Day SEC Yield | -- |
| Number of Holdings | 25 |
| Stock | |
| Weighted Average PE Ratio | 28.98 |
| Weighted Average Price to Sales Ratio | 6.757 |
| Weighted Average Price to Book Ratio | 8.084 |
| Weighted Median ROE | 52.23% |
| Weighted Median ROA | 13.07% |
| ROI (TTM) | 19.52% |
| Return on Investment (TTM) | 19.52% |
| Earning Yield | 0.0566 |
| LT Debt / Shareholders Equity | 0.6791 |
| Number of Equity Holdings | 0 |
| Bond | |
| Yield to Maturity (4-30-26) | 4.84% |
| Effective Duration | -- |
| Average Coupon | 4.62% |
| Calculated Average Quality | 2.643 |
| Effective Maturity | 12.82 |
| Nominal Maturity | 12.90 |
| Number of Bond Holdings | 0 |
As of April 30, 2026
Growth Metrics
| EPS Growth (1Y) | 21.41% |
| EPS Growth (3Y) | 14.73% |
| EPS Growth (5Y) | 20.18% |
| Sales Growth (1Y) | 12.06% |
| Sales Growth (3Y) | 10.15% |
| Sales Growth (5Y) | 13.21% |
| Sales per Share Growth (1Y) | 167.6% |
| Sales per Share Growth (3Y) | 12.03% |
| Operating Cash Flow - Growth Rate (3Y) | 17.71% |
As of April 30, 2026
Fund Details
| Key Dates | |
| Inception Date | 4/29/2005 |
| Last Annual Report Date | 12/31/2025 |
| Last Prospectus Date | 4/30/2025 |
| Share Classes | |
| CAAMX | A |
| CACMX | C |
| CMAIX | Retirement |
| CMARX | Retirement |
| CMASX | S |
| CNSSX | Retirement |
| Attributes | |
| Index Fund | -- |
| Inverse Fund | No |
| Leveraged Fund | -- |
| Fund of Funds |
|
| Currency Hedged Fund | -- |
| Socially Responsible Fund | No |
Top Portfolio Holders
| Name | % Weight |
|---|---|
| Portfolio A | 5.00% |
| Portfolio B | 3.50% |
| Portfolio C | 2.25% |
Excel Add-In Codes
| Name: =YCI("M:CAAYX", "name") |
| Broad Asset Class: =YCI("M:CAAYX", "broad_asset_class") |
| Broad Category: =YCI("M:CAAYX", "broad_category_group") |
| Prospectus Objective: =YCI("M:CAAYX", "prospectus_objective") |
| To find the codes for any of our securities and financial metrics, see our Complete Excel Reference. |