

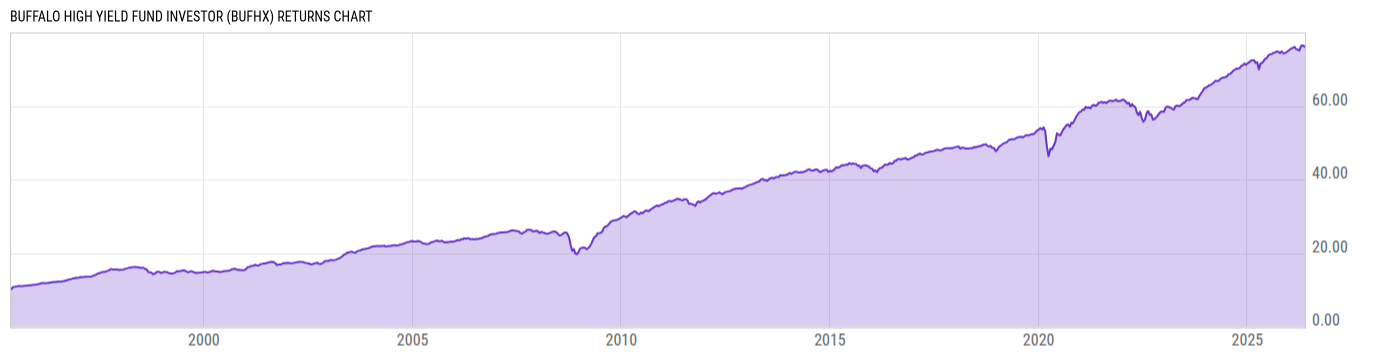
Buffalo High Yield Fund Investor (BUFHX)
10.45
+0.01
(+0.10%)
USD |
Jun 09 2026
Returns Chart
Key Stats
| Net Expense Ratio | Total Assets Under Management | Weighted Average Dividend Yield | Turnover Ratio (Generic) |
|---|---|---|---|
| 1.02% | 650.79M | -- | 29.00% |
| 1 Year Fund Level Flows | 1 Year Total Returns (Daily) | Annualized Total Returns Since Inception (Daily) | Max Drawdown (Since Inception) |
| -54.67M | 4.59% |
Basic Info
| Investment Strategy | |
| The Fund seeks a high level of current income and secondarily, capital growth. The Fund invests primarily in a diversified portfolio of high-yielding fixed income securities. |
| General | |
| Security Type | Mutual Fund |
| Equity Style | -- |
| Broad Asset Class | Taxable Bond |
| Broad Category | Fixed Income |
| Global Peer Group | Bond USD High Yield |
| Peer Group | High Yield Funds |
| Global Macro | Bond High Yield |
| US Macro | High Yield Funds |
| YCharts Categorization | -- |
| YCharts Benchmark | -- |
| Prospectus Objective | High Yield Funds |
| Fund Owner Firm Name | Buffalo Funds |
| Broad Asset Class Benchmark Index | |
| ^BBUSATR | 100.0% |
Net Fund Flows Versus Peer Group
1 Month
% Rank:
72
-2.560B
Peer Group Low
510.03M
Peer Group High
1 Year
% Rank:
65
-54.67M
-2.841B
Peer Group Low
12.05B
Peer Group High
3 Months
% Rank:
69
-2.713B
Peer Group Low
900.82M
Peer Group High
3 Years
% Rank:
21
-4.326B
Peer Group Low
13.55B
Peer Group High
6 Months
% Rank:
67
-2.877B
Peer Group Low
1.301B
Peer Group High
5 Years
% Rank:
14
-9.174B
Peer Group Low
14.79B
Peer Group High
YTD
% Rank:
64
-4.190B
Peer Group Low
1.217B
Peer Group High
10 Years
% Rank:
11
-9.701B
Peer Group Low
21.92B
Peer Group High
Date Unavailable
Risk
Performance Versus Peer Group
Annual Total Returns Versus Peers
As of June 10, 2026.
Asset Allocation
As of March 31, 2026.
| Type | % Net |
|---|---|
| Cash | 2.40% |
| Stock | 0.00% |
| Bond | 93.32% |
| Convertible | 0.00% |
| Preferred | 2.01% |
| Other | 2.27% |
Top 10 Holdings
| Name | % Weight | Price | % Change |
|---|---|---|---|
| Fidelity Instl Government Portfolio I | 5.72% | 1.00 | 0.00% |
|
Amneal Pharmaceuticals LLC 01-AUG-2032 Term Loan B
|
2.27% | -- | -- |
| Harrow, Inc. HARRINC 8.625 09/15/2030 FIX USD Corporate 144A | 2.14% | 100.22 | -0.32% |
| GRUPO AEROMEXICO, SOCIEDAD ANONIMA BURSATIL DE CAPITAL VARIABLE GRUPOAE 8.625 11/15/2031 FIX USD Corporate 144A | 2.04% | 101.79 | 0.14% |
| ARDONAGH GROUP FINANCE LIMITED ARDOGRO 8.875 02/15/2032 FIX USD Corporate 144A | 1.77% | 97.75 | 0.13% |
|
Veritiv Corp 30-NOV-2030 Term Loan B
|
1.75% | -- | -- |
| Saturn Oil & Gas Inc. SATUOIL 9.625 06/15/2029 FIX USD Corporate 144A | 1.64% | 104.90 | 0.01% |
|
Endo International PLC 23-APR-2031 Term Loan B
|
1.49% | -- | -- |
|
Nexus Buyer LLC 31-JUL-2031 Term Loan B
|
1.26% | -- | -- |
| PROVIDENT FUNDING ASSOCIATES, L.P. PROVFUN 9.75 09/15/2029 FIX USD Corporate 144A | 1.24% | 104.12 | -0.13% |
Fees & Availability
| Fees | |
| Actual 12B-1 Fee | -- |
| Actual Management Fee | 0.85% |
| Administration Fee | -- |
| Maximum Front Load | -- |
| Maximum Deferred Load | -- |
| Maximum Redemption Fee | 0.00% |
| General Availability | |
| Available for Insurance Product | No |
| Available for RRSP | No |
| Purchase Details | |
| Open to New Investors |
|
| Minimum Initial Investment | 2500.00 None |
| Minimum Subsequent Investment | 100.00 None |
Basic Info
| Investment Strategy | |
| The Fund seeks a high level of current income and secondarily, capital growth. The Fund invests primarily in a diversified portfolio of high-yielding fixed income securities. |
| General | |
| Security Type | Mutual Fund |
| Equity Style | -- |
| Broad Asset Class | Taxable Bond |
| Broad Category | Fixed Income |
| Global Peer Group | Bond USD High Yield |
| Peer Group | High Yield Funds |
| Global Macro | Bond High Yield |
| US Macro | High Yield Funds |
| YCharts Categorization | -- |
| YCharts Benchmark | -- |
| Prospectus Objective | High Yield Funds |
| Fund Owner Firm Name | Buffalo Funds |
| Broad Asset Class Benchmark Index | |
| ^BBUSATR | 100.0% |
Fundamentals
| General | |
| Distribution Yield | -- |
| Dividend Yield TTM (6-8-26) | 6.95% |
| 30-Day SEC Yield (9-30-19) | 2.99% |
| 7-Day SEC Yield | -- |
| Number of Holdings | 172 |
| Bond | |
| Yield to Maturity (3-31-26) | 7.84% |
| Effective Duration | 2.04 |
| Average Coupon | 8.28% |
| Calculated Average Quality | 5.936 |
| Effective Maturity | 4.773 |
| Nominal Maturity | 4.863 |
| Number of Bond Holdings | 163 |
As of March 31, 2026
Fund Details
| Key Dates | |
| Inception Date | 5/19/1995 |
| Last Annual Report Date | 3/31/2025 |
| Last Prospectus Date | 7/29/2025 |
| Share Classes | |
| BUIHX | Inst |
| Attributes | |
| Index Fund | -- |
| Inverse Fund | No |
| Leveraged Fund | -- |
| Fund of Funds | No |
| Currency Hedged Fund | -- |
| Socially Responsible Fund | No |
Top Portfolio Holders
| Name | % Weight |
|---|---|
| Portfolio A | 5.00% |
| Portfolio B | 3.50% |
| Portfolio C | 2.25% |
Excel Add-In Codes
| Name: =YCI("M:BUFHX", "name") |
| Broad Asset Class: =YCI("M:BUFHX", "broad_asset_class") |
| Broad Category: =YCI("M:BUFHX", "broad_category_group") |
| Prospectus Objective: =YCI("M:BUFHX", "prospectus_objective") |
| To find the codes for any of our securities and financial metrics, see our Complete Excel Reference. |