

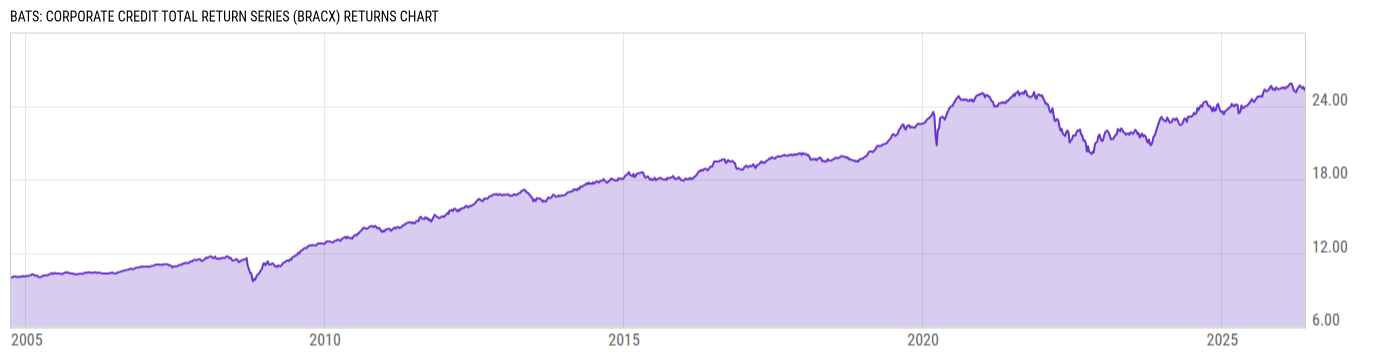
BATS: Corporate Credit Total Return Series (BRACX)
8.95
+0.02
(+0.22%)
USD |
Jun 09 2026
Returns Chart
Key Stats
| Net Expense Ratio | Total Assets Under Management | Weighted Average Dividend Yield | Turnover Ratio (Generic) |
|---|---|---|---|
| 0.00% | 494.89M | -- | 446.0% |
| 1 Year Fund Level Flows | 1 Year Total Returns (Daily) | Annualized Total Returns Since Inception (Daily) | Max Drawdown (Since Inception) |
| 67.69M | 5.91% |
Basic Info
| Investment Strategy | |
| The Portfolio seeks to maximize total return, consistent with income generation and prudent investment management. The Portfolio invests only in securities that are rated investment grade. |
| General | |
| Security Type | Mutual Fund |
| Equity Style | -- |
| Broad Asset Class | Taxable Bond |
| Broad Category | Fixed Income |
| Global Peer Group | Bond USD Corporates |
| Peer Group | Corporate Debt Funds BBB-Rated |
| Global Macro | Bond Corporates |
| US Macro | General Domestic Taxable Fixed Income Funds |
| YCharts Categorization | -- |
| YCharts Benchmark | -- |
| Prospectus Objective | Corporate Debt Funds BBB-Rated |
| Fund Owner Firm Name | BlackRock |
| Broad Asset Class Benchmark Index | |
| ^BBUSATR | 100.0% |
Net Fund Flows Versus Peer Group
1 Month
% Rank:
23
-1.441B
Peer Group Low
748.99M
Peer Group High
1 Year
% Rank:
27
67.69M
-3.244B
Peer Group Low
12.80B
Peer Group High
3 Months
% Rank:
34
-1.908B
Peer Group Low
1.681B
Peer Group High
3 Years
% Rank:
31
-9.856B
Peer Group Low
25.39B
Peer Group High
6 Months
% Rank:
23
-3.368B
Peer Group Low
8.887B
Peer Group High
5 Years
% Rank:
41
-10.18B
Peer Group Low
26.92B
Peer Group High
YTD
% Rank:
26
-471.58M
Peer Group Low
7.655B
Peer Group High
10 Years
% Rank:
44
-8.640B
Peer Group Low
62.93B
Peer Group High
Date Unavailable
Risk
Performance Versus Peer Group
Annual Total Returns Versus Peers
As of June 10, 2026.
Asset Allocation
As of December 31, 2025.
| Type | % Net |
|---|---|
| Cash | -10.81% |
| Stock | 0.00% |
| Bond | 99.76% |
| Convertible | 0.00% |
| Preferred | 0.00% |
| Other | 11.04% |
Top 10 Holdings
| Name | % Weight | Price | % Change |
|---|---|---|---|
|
10Y TNOTES JUN26
|
4.91% | -- | -- |
|
USD CASH
|
4.19% | -- | -- |
|
2YR T-NOTE JUN26
|
3.60% | -- | -- |
|
5YR T NOTE JUN26
|
2.85% | -- | -- |
|
VERIZON COMMUNICATIONS INC CREDIT DEFAULT SWAP
|
1.73% | -- | -- |
| BEIGNET INVESTOR LLC BEIGINV 6.581 05/30/2049 FIX USD Corporate 144A | 1.70% | 101.69 | 0.07% |
| Expand Energy Corporation EXPENE 5.375 02/01/2029 FIX USD Corporate | 1.29% | 100.01 | 0.00% |
|
ULTRA BOND JUN26
|
1.06% | -- | -- |
|
US T BONDS JUN26
|
1.04% | -- | -- |
| United States of America USGB 3.875 02/15/2043 FIX USD Government | 0.97% | 87.75 | 0.49% |
Fees & Availability
| Fees | |
| Actual 12B-1 Fee | -- |
| Actual Management Fee | -- |
| Administration Fee | -- |
| Maximum Front Load | -- |
| Maximum Deferred Load | -- |
| Maximum Redemption Fee | -- |
| General Availability | |
| Available for Insurance Product | No |
| Available for RRSP | No |
| Purchase Details | |
| Open to New Investors |
|
| Minimum Initial Investment | 0.00 None |
| Minimum Subsequent Investment | 0.00 None |
Basic Info
| Investment Strategy | |
| The Portfolio seeks to maximize total return, consistent with income generation and prudent investment management. The Portfolio invests only in securities that are rated investment grade. |
| General | |
| Security Type | Mutual Fund |
| Equity Style | -- |
| Broad Asset Class | Taxable Bond |
| Broad Category | Fixed Income |
| Global Peer Group | Bond USD Corporates |
| Peer Group | Corporate Debt Funds BBB-Rated |
| Global Macro | Bond Corporates |
| US Macro | General Domestic Taxable Fixed Income Funds |
| YCharts Categorization | -- |
| YCharts Benchmark | -- |
| Prospectus Objective | Corporate Debt Funds BBB-Rated |
| Fund Owner Firm Name | BlackRock |
| Broad Asset Class Benchmark Index | |
| ^BBUSATR | 100.0% |
Fundamentals
| General | |
| Distribution Yield | -- |
| Dividend Yield TTM (6-8-26) | 5.29% |
| 30-Day SEC Yield (2-29-24) | 5.51% |
| 7-Day SEC Yield | -- |
| Number of Holdings | 10 |
| Bond | |
| Yield to Maturity (12-31-25) | 4.99% |
| Effective Duration | -- |
| Average Coupon | 4.96% |
| Calculated Average Quality | 3.563 |
| Effective Maturity | 10.72 |
| Nominal Maturity | 11.88 |
| Number of Bond Holdings | 3 |
As of December 31, 2025
Fund Details
| Key Dates | |
| Inception Date | 10/1/2004 |
| Last Annual Report Date | 3/31/2025 |
| Last Prospectus Date | 10/1/2025 |
| Attributes | |
| Index Fund | -- |
| Inverse Fund | No |
| Leveraged Fund | -- |
| Fund of Funds | No |
| Currency Hedged Fund | -- |
| Socially Responsible Fund | No |
Top Portfolio Holders
| Name | % Weight |
|---|---|
| Portfolio A | 5.00% |
| Portfolio B | 3.50% |
| Portfolio C | 2.25% |
Excel Add-In Codes
| Name: =YCI("M:BRACX", "name") |
| Broad Asset Class: =YCI("M:BRACX", "broad_asset_class") |
| Broad Category: =YCI("M:BRACX", "broad_category_group") |
| Prospectus Objective: =YCI("M:BRACX", "prospectus_objective") |
| To find the codes for any of our securities and financial metrics, see our Complete Excel Reference. |