

BMO Managed Balanced Portfolio Series NBA (BMO50476)
18.40
+0.06
(+0.31%)
CAD |
Jun 01 2026
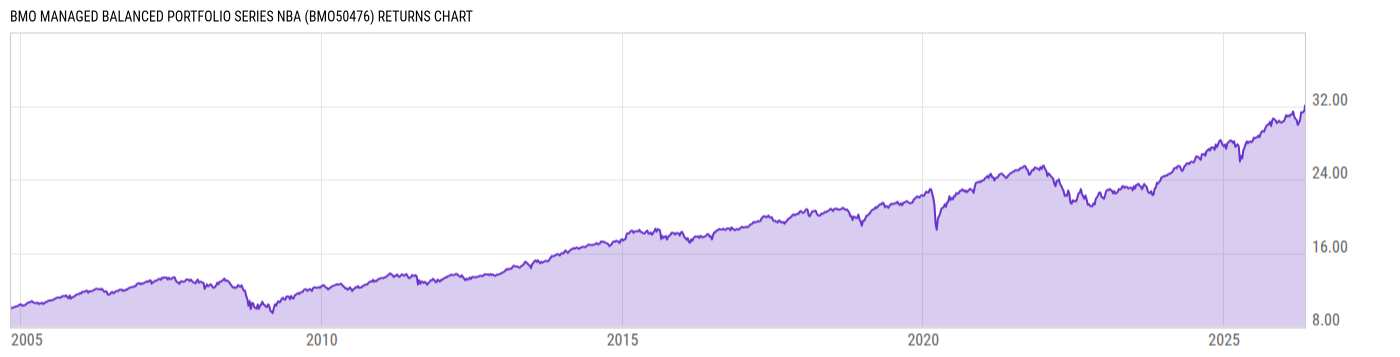
Returns Chart
Key Stats
| Net Expense Ratio | Total Assets Under Management | Weighted Average Dividend Yield | Turnover Ratio (Generic) |
|---|---|---|---|
| 1.72% | 209.86M | -- | 10.06% |
| 1 Year Fund Level Flows | 1 Year Total Returns (Daily) | Annualized Total Returns Since Inception (Daily) | Max Drawdown (Since Inception) |
| 13.95M | 16.37% |
Basic Info
| Investment Strategy | |
| This funds objective is to provide you with a balance of income and growth by investing primarily in a mix of mutual funds invested in fixed income and equity securities. The fund may also invest directly in fixed income securities and cash or cash equivalents. |
| General | |
| Security Type | Mutual Fund |
| Equity Style | -- |
| Broad Asset Class | Allocation |
| Broad Category | Allocation |
| Global Peer Group | Mixed Asset CAD Balanced - Global |
| Peer Group | Global Neutral Balanced |
| Global Macro | -- |
| US Macro | -- |
| YCharts Categorization | -- |
| YCharts Benchmark | -- |
| Prospectus Objective | -- |
| Fund Owner Firm Name | BMO Global Asset Management |
| Broad Asset Class Benchmark Index | |
| ^SPTSX60TR | 100.0% |
Net Fund Flows Versus Peer Group
1 Month
% Rank:
18
-236.66M
Peer Group Low
358.00M
Peer Group High
1 Year
% Rank:
23
13.95M
-2.511B
Peer Group Low
6.806B
Peer Group High
3 Months
% Rank:
23
-903.96M
Peer Group Low
1.217B
Peer Group High
3 Years
% Rank:
20
-2.791B
Peer Group Low
11.88B
Peer Group High
6 Months
% Rank:
31
-1.610B
Peer Group Low
5.121B
Peer Group High
5 Years
% Rank:
27
-3.283B
Peer Group Low
18.25B
Peer Group High
YTD
% Rank:
24
-903.96M
Peer Group Low
2.250B
Peer Group High
10 Years
% Rank:
72
-2.987B
Peer Group Low
31.56B
Peer Group High
Date Unavailable
Risk
Performance Versus Peer Group
Annual Total Returns Versus Peers
As of June 02, 2026.
Asset Allocation
As of April 30, 2026.
| Type | % Net |
|---|---|
| Cash | 0.90% |
| Stock | 60.03% |
| Bond | 33.16% |
| Convertible | 0.00% |
| Preferred | 0.11% |
| Other | 5.80% |
Top 10 Holdings
| Name | % Weight | Price | % Change |
|---|---|---|---|
|
BMO MULTI-FACTOR EQUITY FUND SERIES I
|
12.83% | -- | -- |
|
BMO CORE PLUS BOND SERIES I
|
10.63% | -- | -- |
|
BMO CANADIAN SMART ALPHA EQUITY SERIES I
|
9.18% | -- | -- |
|
BMO GLOBAL EQUITY SERIES I
|
7.15% | -- | -- |
| BMO US Aggregate Bond Index ETF (Hedged Units) | 6.30% | 29.59 | 0.07% |
|
BMO JAPAN FUND SERIES I
|
4.27% | -- | -- |
| BMO MSCI EAFE Index ETF | 4.15% | 30.88 | 0.59% |
| BMO High Yield US Corp Bd Hgd to CAD Idx Fd Sr ETF | 4.05% | 10.97 | -0.63% |
|
BMO EUROPEAN SERIES I
|
3.99% | -- | -- |
| BMO S&P 500 Index ETF | 3.54% | 115.42 | 0.13% |
Fees & Availability
| Fees | |
| Actual 12B-1 Fee | -- |
| Actual Management Fee | -- |
| Administration Fee | -- |
| Maximum Front Load | -- |
| Maximum Deferred Load | -- |
| Maximum Redemption Fee | -- |
| General Availability | |
| Available for Insurance Product | No |
| Available for RRSP |
|
| Purchase Details | |
| Open to New Investors |
|
| Minimum Initial Investment | 1000.00 None |
| Minimum Subsequent Investment | 100.00 None |
Basic Info
| Investment Strategy | |
| This funds objective is to provide you with a balance of income and growth by investing primarily in a mix of mutual funds invested in fixed income and equity securities. The fund may also invest directly in fixed income securities and cash or cash equivalents. |
| General | |
| Security Type | Mutual Fund |
| Equity Style | -- |
| Broad Asset Class | Allocation |
| Broad Category | Allocation |
| Global Peer Group | Mixed Asset CAD Balanced - Global |
| Peer Group | Global Neutral Balanced |
| Global Macro | -- |
| US Macro | -- |
| YCharts Categorization | -- |
| YCharts Benchmark | -- |
| Prospectus Objective | -- |
| Fund Owner Firm Name | BMO Global Asset Management |
| Broad Asset Class Benchmark Index | |
| ^SPTSX60TR | 100.0% |
Fundamentals
| General | |
| Distribution Yield | -- |
| Dividend Yield TTM (6-1-26) | 0.67% |
| 30-Day SEC Yield | -- |
| 7-Day SEC Yield | -- |
| Number of Holdings | 10 |
| Stock | |
| Weighted Average PE Ratio | 29.15 |
| Weighted Average Price to Sales Ratio | 7.072 |
| Weighted Average Price to Book Ratio | 7.614 |
| Weighted Median ROE | 67.31% |
| Weighted Median ROA | 11.89% |
| ROI (TTM) | 18.22% |
| Return on Investment (TTM) | 18.22% |
| Earning Yield | 0.0525 |
| LT Debt / Shareholders Equity | 0.7542 |
| Number of Equity Holdings | 0 |
| Bond | |
| Yield to Maturity (4-30-26) | 4.67% |
| Effective Duration | -- |
| Average Coupon | 4.65% |
| Calculated Average Quality | 3.341 |
| Effective Maturity | 9.759 |
| Nominal Maturity | 9.901 |
| Number of Bond Holdings | 0 |
As of April 30, 2026
Growth Metrics
| EPS Growth (1Y) | 27.57% |
| EPS Growth (3Y) | 18.97% |
| EPS Growth (5Y) | 22.14% |
| Sales Growth (1Y) | 14.46% |
| Sales Growth (3Y) | 11.85% |
| Sales Growth (5Y) | 13.56% |
| Sales per Share Growth (1Y) | 78.67% |
| Sales per Share Growth (3Y) | 12.65% |
| Operating Cash Flow - Growth Rate (3Y) | 22.17% |
As of April 30, 2026
Fund Details
| Key Dates | |
| Launch Date | 11/1/2004 |
| Last Annual Report Date | 9/30/2025 |
| Last Prospectus Date | -- |
| Share Classes | |
| BMO70476 | Commission-based Advice |
| BMO95746 | Fee-based Advice |
| BMO99476 | Commission-based Advice |
| Attributes | |
| Index Fund | -- |
| Inverse Fund | No |
| Leveraged Fund | -- |
| Fund of Funds | No |
| Currency Hedged Fund | -- |
| Socially Responsible Fund | No |
Top Portfolio Holders
| Name | % Weight |
|---|---|
| Portfolio A | 5.00% |
| Portfolio B | 3.50% |
| Portfolio C | 2.25% |
Excel Add-In Codes
| Name: =YCI("M:BMO50476", "name") |
| Broad Asset Class: =YCI("M:BMO50476", "broad_asset_class") |
| Broad Category: =YCI("M:BMO50476", "broad_category_group") |
| Prospectus Objective: =YCI("M:BMO50476", "prospectus_objective") |
| To find the codes for any of our securities and financial metrics, see our Complete Excel Reference. |