

abrdn High Income Opportunities Fund A (BJBHX)
7.70
0.00 (0.00%)
USD |
Jun 09 2026
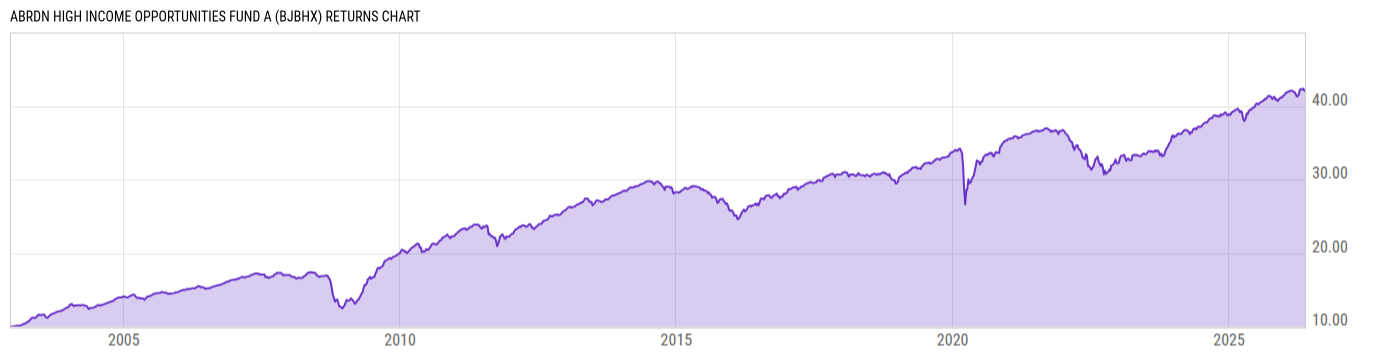
Returns Chart
Key Stats
| Net Expense Ratio | Total Assets Under Management | Weighted Average Dividend Yield | Turnover Ratio (Generic) |
|---|---|---|---|
| 0.96% | 73.39M | -- | 90.00% |
| 1 Year Fund Level Flows | 1 Year Total Returns (Daily) | Annualized Total Returns Since Inception (Daily) | Max Drawdown (Since Inception) |
| -9.373M | 6.32% |
Basic Info
| Investment Strategy | |
| The Fund seeks to maximize total return, principally through a high level of current income, and secondarily through capital appreciation. The Fund normally invests at least 80% of its net assets in a diversified portfolio of below investment grade, fixed income securities of issues located throughout the world. |
| General | |
| Security Type | Mutual Fund |
| Equity Style | -- |
| Broad Asset Class | Taxable Bond |
| Broad Category | Fixed Income |
| Global Peer Group | Bond Global High Yield USD |
| Peer Group | Global High Yield Funds |
| Global Macro | Bond High Yield |
| US Macro | High Yield Funds |
| YCharts Categorization | -- |
| YCharts Benchmark | -- |
| Prospectus Objective | Global High Yield Funds |
| Fund Owner Firm Name | Aberdeen Investments |
| Broad Asset Class Benchmark Index | |
| ^BBUSATR | 100.0% |
Net Fund Flows Versus Peer Group
1 Month
% Rank:
58
-102.99M
Peer Group Low
259.98M
Peer Group High
1 Year
% Rank:
43
-9.373M
-208.83M
Peer Group Low
267.35M
Peer Group High
3 Months
% Rank:
33
-140.79M
Peer Group Low
259.98M
Peer Group High
3 Years
% Rank:
56
-1.177B
Peer Group Low
1.062B
Peer Group High
6 Months
% Rank:
51
-491.00M
Peer Group Low
259.98M
Peer Group High
5 Years
% Rank:
53
-2.590B
Peer Group Low
2.289B
Peer Group High
YTD
% Rank:
48
-303.35M
Peer Group Low
259.98M
Peer Group High
10 Years
% Rank:
81
-5.038B
Peer Group Low
2.289B
Peer Group High
Date Unavailable
Risk
Performance Versus Peer Group
Annual Total Returns Versus Peers
As of June 10, 2026.
Asset Allocation
As of March 31, 2026.
| Type | % Net |
|---|---|
| Cash | 3.79% |
| Stock | 0.00% |
| Bond | 95.62% |
| Convertible | 0.00% |
| Preferred | 0.00% |
| Other | 0.59% |
Top 10 Holdings
| Name | % Weight | Price | % Change |
|---|---|---|---|
|
USD CASH
|
1.78% | -- | -- |
| AFFINITY INTERACTIVE AFINTE 6.875 12/15/2027 FIX USD Corporate 144A | 1.42% | 58.08 | 3.37% |
| TransDigm Inc. TRADIG 6.625 03/01/2032 FIX USD Corporate 144A | 1.38% | 102.65 | 0.06% |
| DELEK LOGISTICS PARTNERS, LP DELELOG 8.625 03/15/2029 FIX USD Corporate 144A | 1.34% | 104.10 | 0.06% |
| ROGERS COMMUNICATIONS INC. RCI 7.0 04/15/2055 FLT USD Corporate '30 | 1.24% | 102.35 | -0.13% |
|
CD&R FIREFLY BIDCO PLC FRN 09-APR-2029
|
1.18% | -- | -- |
| New Enterprise Stone & Lime Co., Inc. NENSL 5.25 07/15/2028 FIX USD Corporate 144A | 1.06% | 99.67 | 0.03% |
| CIMPRESS PUBLIC LIMITED COMPANY CIMPPUB 7.375 09/15/2032 FIX USD Corporate 144A | 1.04% | 100.79 | 0.18% |
|
BALL CORP 4.25% 01-JUL-2032
|
1.03% | -- | -- |
| Builders FirstSource, Inc. BUFS 6.75 05/15/2035 FIX USD Corporate 144A | 1.02% | 100.92 | 0.18% |
Fees & Availability
| Fees | |
| Actual 12B-1 Fee | 0.25% |
| Actual Management Fee | 0.12% |
| Administration Fee | 41.55K% |
| Maximum Front Load | 3.00% |
| Maximum Deferred Load | -- |
| Maximum Redemption Fee | 0.00% |
| General Availability | |
| Available for Insurance Product | No |
| Available for RRSP | No |
| Purchase Details | |
| Open to New Investors |
|
| Minimum Initial Investment | 1000.00 None |
| Minimum Subsequent Investment | 50.00 None |
Basic Info
| Investment Strategy | |
| The Fund seeks to maximize total return, principally through a high level of current income, and secondarily through capital appreciation. The Fund normally invests at least 80% of its net assets in a diversified portfolio of below investment grade, fixed income securities of issues located throughout the world. |
| General | |
| Security Type | Mutual Fund |
| Equity Style | -- |
| Broad Asset Class | Taxable Bond |
| Broad Category | Fixed Income |
| Global Peer Group | Bond Global High Yield USD |
| Peer Group | Global High Yield Funds |
| Global Macro | Bond High Yield |
| US Macro | High Yield Funds |
| YCharts Categorization | -- |
| YCharts Benchmark | -- |
| Prospectus Objective | Global High Yield Funds |
| Fund Owner Firm Name | Aberdeen Investments |
| Broad Asset Class Benchmark Index | |
| ^BBUSATR | 100.0% |
Fundamentals
| General | |
| Distribution Yield | -- |
| Dividend Yield TTM (6-8-26) | 6.04% |
| 30-Day SEC Yield (4-30-26) | 0.06% |
| 7-Day SEC Yield | -- |
| Number of Holdings | 213 |
| Bond | |
| Yield to Maturity (3-31-26) | 7.36% |
| Effective Duration | 3.13 |
| Average Coupon | 6.96% |
| Calculated Average Quality | 5.575 |
| Effective Maturity | 5.851 |
| Nominal Maturity | 6.043 |
| Number of Bond Holdings | 194 |
As of March 31, 2026
Fund Details
| Key Dates | |
| Inception Date | 12/17/2002 |
| Last Annual Report Date | 10/31/2025 |
| Last Prospectus Date | 2/28/2026 |
| Share Classes | |
| JHYIX | Inst |
| Attributes | |
| Index Fund | -- |
| Inverse Fund | No |
| Leveraged Fund | -- |
| Fund of Funds | No |
| Currency Hedged Fund | -- |
| Socially Responsible Fund | No |
Top Portfolio Holders
| Name | % Weight |
|---|---|
| Portfolio A | 5.00% |
| Portfolio B | 3.50% |
| Portfolio C | 2.25% |
Excel Add-In Codes
| Name: =YCI("M:BJBHX", "name") |
| Broad Asset Class: =YCI("M:BJBHX", "broad_asset_class") |
| Broad Category: =YCI("M:BJBHX", "broad_category_group") |
| Prospectus Objective: =YCI("M:BJBHX", "prospectus_objective") |
| To find the codes for any of our securities and financial metrics, see our Complete Excel Reference. |