

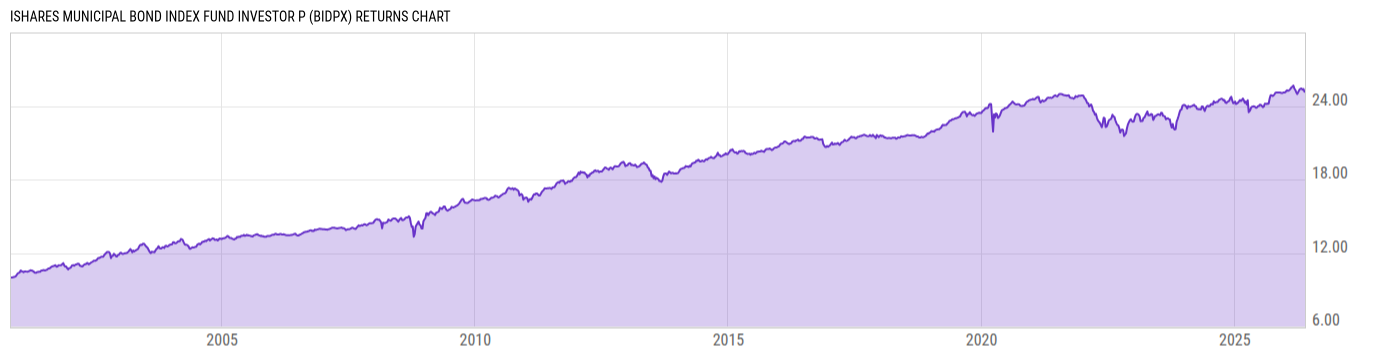
iShares Municipal Bond Index Fund Investor P (BIDPX)
10.89
0.00 (0.00%)
USD |
May 22 2026
Returns Chart
Key Stats
| Net Expense Ratio | Total Assets Under Management | Weighted Average Dividend Yield | Turnover Ratio (Generic) |
|---|---|---|---|
| 0.49% | 205.65M | -- | 38.00% |
| 1 Year Fund Level Flows | 1 Year Total Returns (Daily) | Annualized Total Returns Since Inception (Daily) | Max Drawdown (Since Inception) |
| -20.96M | 5.60% |
Basic Info
| Investment Strategy | |
| The Fund seeks to provide investment results that correspond to the total return performance of the ICE BofAML US Municipal Securities Index which tracks the performance of US dollar denominated investment grade tax-exempt debt publicly issued by US states and territories, in the US domestic market. |
| General | |
| Security Type | Mutual Fund |
| Equity Style | -- |
| Broad Asset Class | Municipal Bond |
| Broad Category | Fixed Income |
| Global Peer Group | Bond USD Municipal |
| Peer Group | General & Insured Municipal Debt Funds |
| Global Macro | Bond HC |
| US Macro | National Municipal Debt Funds |
| YCharts Categorization | -- |
| YCharts Benchmark | -- |
| Prospectus Objective | General & Insured Municipal Debt Funds |
| Fund Owner Firm Name | BlackRock |
| Broad Asset Class Benchmark Index | |
| ^BBMBTR | 100.0% |
Net Fund Flows Versus Peer Group
1 Month
% Rank:
61
-99.16M
Peer Group Low
809.96M
Peer Group High
1 Year
% Rank:
62
-20.96M
-752.82M
Peer Group Low
6.079B
Peer Group High
3 Months
% Rank:
62
-397.00M
Peer Group Low
1.450B
Peer Group High
3 Years
% Rank:
67
-4.696B
Peer Group Low
16.26B
Peer Group High
6 Months
% Rank:
64
-636.26M
Peer Group Low
2.119B
Peer Group High
5 Years
% Rank:
65
-8.303B
Peer Group Low
33.26B
Peer Group High
YTD
% Rank:
68
-391.95M
Peer Group Low
1.826B
Peer Group High
10 Years
% Rank:
80
-7.392B
Peer Group Low
45.51B
Peer Group High
Date Unavailable
Risk
Performance Versus Peer Group
Annual Total Returns Versus Peers
As of May 23, 2026.
Asset Allocation
As of November 30, 2025.
| Type | % Net |
|---|---|
| Cash | -0.29% |
| Stock | 0.00% |
| Bond | 100.3% |
| Convertible | 0.00% |
| Preferred | 0.00% |
| Other | 0.00% |
Top 10 Holdings
| Name | % Weight | Price | % Change |
|---|---|---|---|
| NEW YORK TRANSN DEV CORP SPL FAC REV NY 5.500 12/31/2060 | 0.98% | 100.15 | 0.26% |
| NEW YORK N Y NY 4.000 08/01/2040 | 0.88% | 97.86 | 0.22% |
| PORT AUTH N Y & N J NY 5.000 07/15/2036 | 0.82% | 108.40 | 0.11% |
| NEW JERSEY ST NJ 4.000 06/01/2031 | 0.77% | 105.24 | 0.08% |
| LOS ANGELES CALIF UNI SCH DIST CA 5.000 07/01/2033 | 0.76% | 103.60 | 0.01% |
| NEW YORK N Y CITY TRANSITIONAL FIN AUTH BLDG AID REV NY 4.000 07/15/2036 | 0.71% | 100.54 | 0.04% |
| WASHINGTON D C MET AREA TRAN AUTH DEDICATED REV DC 4.000 07/15/2045 | 0.70% | 95.71 | 0.25% |
| MIAMI-DADE CNTY FLA TRAN SYS SALES SURTAX REV FL 4.000 07/01/2050 | 0.65% | 89.66 | 0.30% |
| MASSACHUSETTS ST MA 4.000 09/01/2032 | 0.64% | 100.20 | -0.00% |
| NEW YORK ST DORM AUTH ST PERS INCOME TAX REV NY 3.000 03/15/2041 | 0.63% | 86.27 | 0.24% |
Fees & Availability
| Fees | |
| Actual 12B-1 Fee | 0.25% |
| Actual Management Fee | 0.06% |
| Administration Fee | -- |
| Maximum Front Load | 4.00% |
| Maximum Deferred Load | -- |
| Maximum Redemption Fee | -- |
| General Availability | |
| Available for Insurance Product | No |
| Available for RRSP | No |
| Purchase Details | |
| Open to New Investors |
|
| Minimum Initial Investment | 1000.00 None |
| Minimum Subsequent Investment | 50.00 None |
Basic Info
| Investment Strategy | |
| The Fund seeks to provide investment results that correspond to the total return performance of the ICE BofAML US Municipal Securities Index which tracks the performance of US dollar denominated investment grade tax-exempt debt publicly issued by US states and territories, in the US domestic market. |
| General | |
| Security Type | Mutual Fund |
| Equity Style | -- |
| Broad Asset Class | Municipal Bond |
| Broad Category | Fixed Income |
| Global Peer Group | Bond USD Municipal |
| Peer Group | General & Insured Municipal Debt Funds |
| Global Macro | Bond HC |
| US Macro | National Municipal Debt Funds |
| YCharts Categorization | -- |
| YCharts Benchmark | -- |
| Prospectus Objective | General & Insured Municipal Debt Funds |
| Fund Owner Firm Name | BlackRock |
| Broad Asset Class Benchmark Index | |
| ^BBMBTR | 100.0% |
Fundamentals
| General | |
| Distribution Yield | -- |
| Dividend Yield TTM (5-21-26) | 3.14% |
| 30-Day SEC Yield (3-31-26) | 2.91% |
| 7-Day SEC Yield | -- |
| Number of Holdings | 10 |
| Bond | |
| Yield to Maturity (11-30-25) | 3.73% |
| Effective Duration | 7.07 |
| Average Coupon | 4.78% |
| Calculated Average Quality | 2.333 |
| Effective Maturity | 13.59 |
| Nominal Maturity | 17.25 |
| Number of Bond Holdings | 10 |
As of November 30, 2025
Fund Details
Top Portfolio Holders
| Name | % Weight |
|---|---|
| Portfolio A | 5.00% |
| Portfolio B | 3.50% |
| Portfolio C | 2.25% |
Excel Add-In Codes
| Name: =YCI("M:BIDPX", "name") |
| Broad Asset Class: =YCI("M:BIDPX", "broad_asset_class") |
| Broad Category: =YCI("M:BIDPX", "broad_category_group") |
| Prospectus Objective: =YCI("M:BIDPX", "prospectus_objective") |
| To find the codes for any of our securities and financial metrics, see our Complete Excel Reference. |