

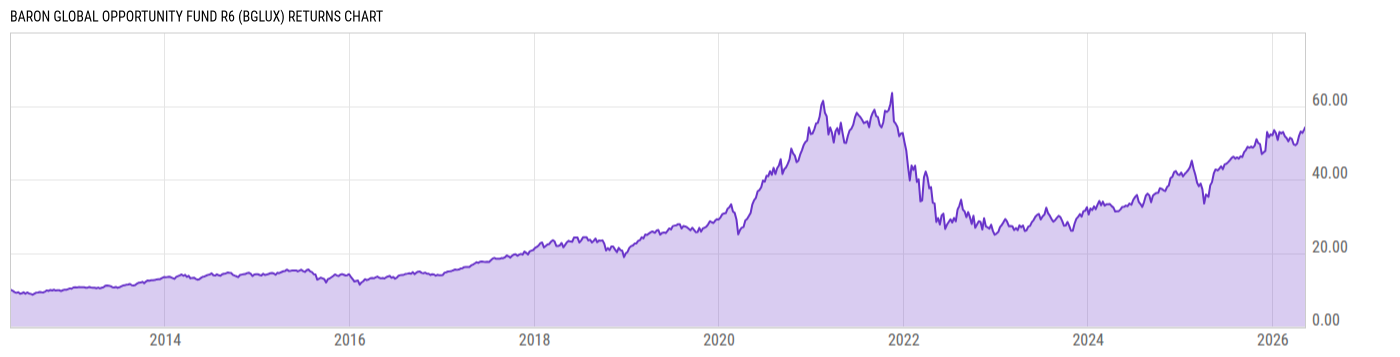
Baron Global Opportunity Fund R6 (BGLUX)
55.75
+0.81
(+1.47%)
USD |
May 29 2026
Returns Chart
Key Stats
| Net Expense Ratio | Total Assets Under Management | Weighted Average Dividend Yield | Turnover Ratio (Generic) |
|---|---|---|---|
| 0.90% | 1.254B | 0.07% | 9.00% |
| 1 Year Fund Level Flows | 1 Year Total Returns (Daily) | Annualized Total Returns Since Inception (Daily) | Max Drawdown (Since Inception) |
| 433.71M | 34.02% |
Basic Info
| Investment Strategy | |
| The Fund seeks capital appreciation. The Fund will invest primarily in established and emerging markets companies located throughout the world, with capitalizations within the range of companies included in the MSCI ACWI Growth Index Net and will have investments in the securities of companies in at least three countries. |
| General | |
| Security Type | Mutual Fund |
| Equity Style | Multi Cap Growth |
| Broad Asset Class | International Equity |
| Broad Category | Equity |
| Global Peer Group | Equity Global |
| Peer Group | Global Multi-Cap Growth |
| Global Macro | Equity Global |
| US Macro | Developed Global Markets Funds |
| YCharts Categorization | -- |
| YCharts Benchmark | -- |
| Prospectus Objective | Global Funds |
| Fund Owner Firm Name | Baron Capital |
| Broad Asset Class Benchmark Index | |
| ^MSACXUSNTR | 100.0% |
Net Fund Flows Versus Peer Group
1 Month
% Rank:
2
-1.084B
Peer Group Low
116.95M
Peer Group High
1 Year
% Rank:
2
433.71M
-3.785B
Peer Group Low
1.314B
Peer Group High
3 Months
% Rank:
2
-1.124B
Peer Group Low
749.03M
Peer Group High
3 Years
% Rank:
40
-6.739B
Peer Group Low
1.792B
Peer Group High
6 Months
% Rank:
2
-1.977B
Peer Group Low
927.64M
Peer Group High
5 Years
% Rank:
77
-7.536B
Peer Group Low
3.109B
Peer Group High
YTD
% Rank:
2
-1.251B
Peer Group Low
917.55M
Peer Group High
10 Years
% Rank:
17
-7.837B
Peer Group Low
7.268B
Peer Group High
Date Unavailable
Risk
Performance Versus Peer Group
Annual Total Returns Versus Peers
As of May 31, 2026.
Asset Allocation
As of March 31, 2026.
| Type | % Net |
|---|---|
| Cash | 1.98% |
| Stock | 98.14% |
| Bond | 0.00% |
| Convertible | 0.00% |
| Preferred | 0.00% |
| Other | -0.12% |
Top 10 Holdings
| Name | % Weight | Price | % Change |
|---|---|---|---|
|
Space Exploration Technologies Corp Class A
|
15.86% | -- | -- |
| NVIDIA Corp. | 7.43% | 211.14 | -1.45% |
| Shopify, Inc. | 5.06% | 118.71 | 3.20% |
| Amazon.com, Inc. | 5.00% | 270.64 | -1.23% |
| Taiwan Semiconductor Manufacturing Co., Ltd. | 4.99% | 418.45 | -1.51% |
| MercadoLibre, Inc. | 4.83% | 1695.65 | 0.01% |
|
Space Exploration Technologies Corp Class C
|
4.73% | -- | -- |
| Cloudflare, Inc. | 3.67% | 241.82 | 6.01% |
| Coupang, Inc. | 3.55% | 16.60 | 2.47% |
| Nu Holdings Ltd. | 3.02% | 13.13 | 0.61% |
Fees & Availability
| Fees | |
| Actual 12B-1 Fee | -- |
| Actual Management Fee | 0.80% |
| Administration Fee | -- |
| Maximum Front Load | -- |
| Maximum Deferred Load | -- |
| Maximum Redemption Fee | -- |
| General Availability | |
| Available for Insurance Product | No |
| Available for RRSP | No |
| Purchase Details | |
| Open to New Investors |
|
| Minimum Initial Investment | 5.00M None |
| Minimum Subsequent Investment | 0.00 None |
Basic Info
| Investment Strategy | |
| The Fund seeks capital appreciation. The Fund will invest primarily in established and emerging markets companies located throughout the world, with capitalizations within the range of companies included in the MSCI ACWI Growth Index Net and will have investments in the securities of companies in at least three countries. |
| General | |
| Security Type | Mutual Fund |
| Equity Style | Multi Cap Growth |
| Broad Asset Class | International Equity |
| Broad Category | Equity |
| Global Peer Group | Equity Global |
| Peer Group | Global Multi-Cap Growth |
| Global Macro | Equity Global |
| US Macro | Developed Global Markets Funds |
| YCharts Categorization | -- |
| YCharts Benchmark | -- |
| Prospectus Objective | Global Funds |
| Fund Owner Firm Name | Baron Capital |
| Broad Asset Class Benchmark Index | |
| ^MSACXUSNTR | 100.0% |
Fundamentals
| General | |
| Distribution Yield | -- |
| Dividend Yield TTM (5-28-26) | 0.18% |
| 30-Day SEC Yield | -- |
| 7-Day SEC Yield | -- |
| Number of Holdings | 49 |
| Stock | |
| Weighted Average PE Ratio | 43.25 |
| Weighted Average Price to Sales Ratio | 10.98 |
| Weighted Average Price to Book Ratio | 11.90 |
| Weighted Median ROE | 22.36% |
| Weighted Median ROA | 13.29% |
| ROI (TTM) | 18.03% |
| Return on Investment (TTM) | 18.03% |
| Earning Yield | 0.0268 |
| LT Debt / Shareholders Equity | 0.5816 |
| Number of Equity Holdings | 47 |
As of March 31, 2026
Growth Metrics
| EPS Growth (1Y) | 16.90% |
| EPS Growth (3Y) | 38.64% |
| EPS Growth (5Y) | 41.71% |
| Sales Growth (1Y) | 34.19% |
| Sales Growth (3Y) | 35.51% |
| Sales Growth (5Y) | 38.62% |
| Sales per Share Growth (1Y) | 41.89% |
| Sales per Share Growth (3Y) | 35.26% |
| Operating Cash Flow - Growth Rate (3Y) | 57.19% |
As of March 31, 2026
Fund Details
Top Portfolio Holders
| Name | % Weight |
|---|---|
| Portfolio A | 5.00% |
| Portfolio B | 3.50% |
| Portfolio C | 2.25% |
Excel Add-In Codes
| Name: =YCI("M:BGLUX", "name") |
| Broad Asset Class: =YCI("M:BGLUX", "broad_asset_class") |
| Broad Category: =YCI("M:BGLUX", "broad_category_group") |
| Prospectus Objective: =YCI("M:BGLUX", "prospectus_objective") |
| To find the codes for any of our securities and financial metrics, see our Complete Excel Reference. |