

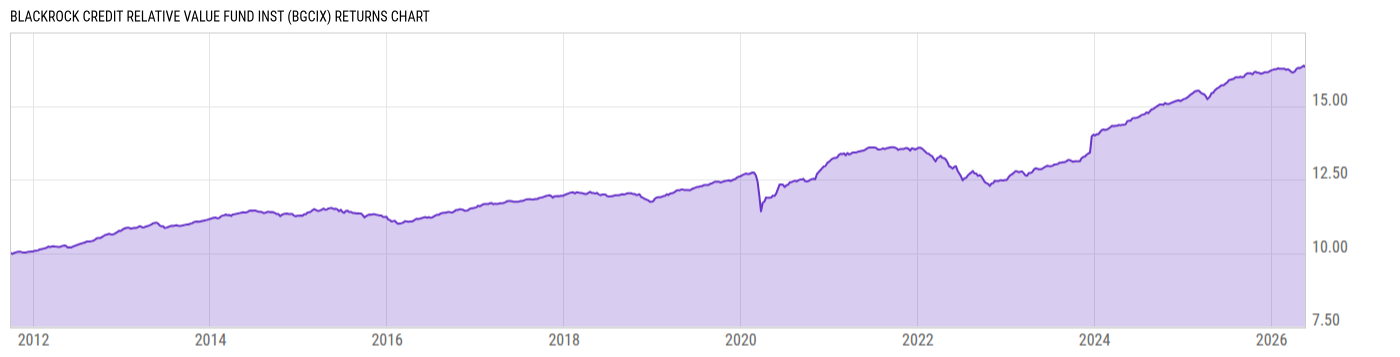
BlackRock Credit Relative Value Fund Inst (BGCIX)
9.16
0.00 (0.00%)
USD |
Jun 09 2026
Returns Chart
Key Stats
| Net Expense Ratio | Total Assets Under Management | Weighted Average Dividend Yield | Turnover Ratio (Generic) |
|---|---|---|---|
| 1.39% | 815.46M | -- | 113.0% |
| 1 Year Fund Level Flows | 1 Year Total Returns (Daily) | Annualized Total Returns Since Inception (Daily) | Max Drawdown (Since Inception) |
| -24.17M | 4.58% |
Basic Info
| Investment Strategy | |
| The Fund seeks to provide absolute total returns over a complete market cycle through diversified long and short exposure to the global fixed-income markets. A complete market cycle for fixed income funds such as the Fund is typically three to five years. The Fund typically invests in credit-related instruments. |
| General | |
| Security Type | Mutual Fund |
| Equity Style | -- |
| Broad Asset Class | Taxable Bond |
| Broad Category | Fixed Income |
| Global Peer Group | Bond Other |
| Peer Group | Specialty Fixed Income Funds |
| Global Macro | Bond Other |
| US Macro | General Domestic Taxable Fixed Income Funds |
| YCharts Categorization | -- |
| YCharts Benchmark | -- |
| Prospectus Objective | Specialty Fixed Income Funds |
| Fund Owner Firm Name | BlackRock |
| Broad Asset Class Benchmark Index | |
| ^BBUSATR | 100.0% |
Net Fund Flows Versus Peer Group
1 Month
% Rank:
22
-109.84M
Peer Group Low
174.25M
Peer Group High
1 Year
% Rank:
92
-24.17M
-2.429B
Peer Group Low
945.32M
Peer Group High
3 Months
% Rank:
35
-194.22M
Peer Group Low
325.65M
Peer Group High
3 Years
% Rank:
98
-466.02M
Peer Group Low
2.656B
Peer Group High
6 Months
% Rank:
90
-1.305B
Peer Group Low
517.86M
Peer Group High
5 Years
% Rank:
97
-1.780B
Peer Group Low
4.893B
Peer Group High
YTD
% Rank:
23
-1.153B
Peer Group Low
449.84M
Peer Group High
10 Years
% Rank:
98
-4.368B
Peer Group Low
5.025B
Peer Group High
Date Unavailable
Risk
Performance Versus Peer Group
Annual Total Returns Versus Peers
As of June 10, 2026.
Asset Allocation
As of December 31, 2025.
| Type | % Net |
|---|---|
| Cash | 5.85% |
| Stock | 1.08% |
| Bond | 86.67% |
| Convertible | 0.00% |
| Preferred | 0.53% |
| Other | 5.88% |
Top 10 Holdings
| Name | % Weight | Price | % Change |
|---|---|---|---|
| BlackRock Liquidity T-Fund Institutional | 16.65% | 1.00 | 0.00% |
|
CREDIT DEFAULT SWAP INDEX NORTH AMERICA INVESTMENT GRADE SER 46 V1
|
12.54% | -- | -- |
|
CREDIT DEFAULT SWAP INDEX ITRAXX CROSSOVER SER 44
|
3.46% | -- | -- |
|
2YR T-NOTE JUN26
|
3.18% | -- | -- |
|
CREDIT DEFAULT SWAP INDEX ITRAXX CROSSOVER SER 42 V3
|
2.33% | -- | -- |
|
BRITISH AIRWAYS FRN 15-DEC-2032
|
1.98% | -- | -- |
| Frontier Communications Holdings, LLC FRCOMM 05/15/2030 FIX USD Corporate 144A (Called) | 1.48% | 102.23 | 0.01% |
| PALOMINO FUNDING TRUST I PALOFUN 7.233 05/17/2028 FIX USD Corporate 144A | 1.43% | 103.86 | 0.07% |
| LIONS GATE CAPITAL HOLDINGS 1, INC. LIONSGA 6.0 04/15/2030 VAR USD Corporate 144A | 1.42% | 94.85 | -0.31% |
| ALEXANDER FUNDING TRUST II ALEXAFU 7.467 07/31/2028 FIX USD Corporate 144A | 1.32% | 104.71 | 0.06% |
Fees & Availability
| Fees | |
| Actual 12B-1 Fee | -- |
| Actual Management Fee | 0.91% |
| Administration Fee | 256.8K% |
| Maximum Front Load | -- |
| Maximum Deferred Load | -- |
| Maximum Redemption Fee | -- |
| General Availability | |
| Available for Insurance Product | No |
| Available for RRSP | No |
| Purchase Details | |
| Open to New Investors |
|
| Minimum Initial Investment | 2.00M None |
| Minimum Subsequent Investment | 0.00 None |
Basic Info
| Investment Strategy | |
| The Fund seeks to provide absolute total returns over a complete market cycle through diversified long and short exposure to the global fixed-income markets. A complete market cycle for fixed income funds such as the Fund is typically three to five years. The Fund typically invests in credit-related instruments. |
| General | |
| Security Type | Mutual Fund |
| Equity Style | -- |
| Broad Asset Class | Taxable Bond |
| Broad Category | Fixed Income |
| Global Peer Group | Bond Other |
| Peer Group | Specialty Fixed Income Funds |
| Global Macro | Bond Other |
| US Macro | General Domestic Taxable Fixed Income Funds |
| YCharts Categorization | -- |
| YCharts Benchmark | -- |
| Prospectus Objective | Specialty Fixed Income Funds |
| Fund Owner Firm Name | BlackRock |
| Broad Asset Class Benchmark Index | |
| ^BBUSATR | 100.0% |
Fundamentals
| General | |
| Distribution Yield | -- |
| Dividend Yield TTM (6-8-26) | 5.76% |
| 30-Day SEC Yield (4-30-26) | 4.44% |
| 7-Day SEC Yield | -- |
| Number of Holdings | 10 |
| Bond | |
| Yield to Maturity (12-31-25) | 4.95% |
| Effective Duration | 0.91 |
| Average Coupon | 6.84% |
| Calculated Average Quality | 4.769 |
| Effective Maturity | 5.540 |
| Nominal Maturity | 6.560 |
| Number of Bond Holdings | 5 |
As of December 31, 2025
Fund Details
Top Portfolio Holders
| Name | % Weight |
|---|---|
| Portfolio A | 5.00% |
| Portfolio B | 3.50% |
| Portfolio C | 2.25% |
Excel Add-In Codes
| Name: =YCI("M:BGCIX", "name") |
| Broad Asset Class: =YCI("M:BGCIX", "broad_asset_class") |
| Broad Category: =YCI("M:BGCIX", "broad_category_group") |
| Prospectus Objective: =YCI("M:BGCIX", "prospectus_objective") |
| To find the codes for any of our securities and financial metrics, see our Complete Excel Reference. |