

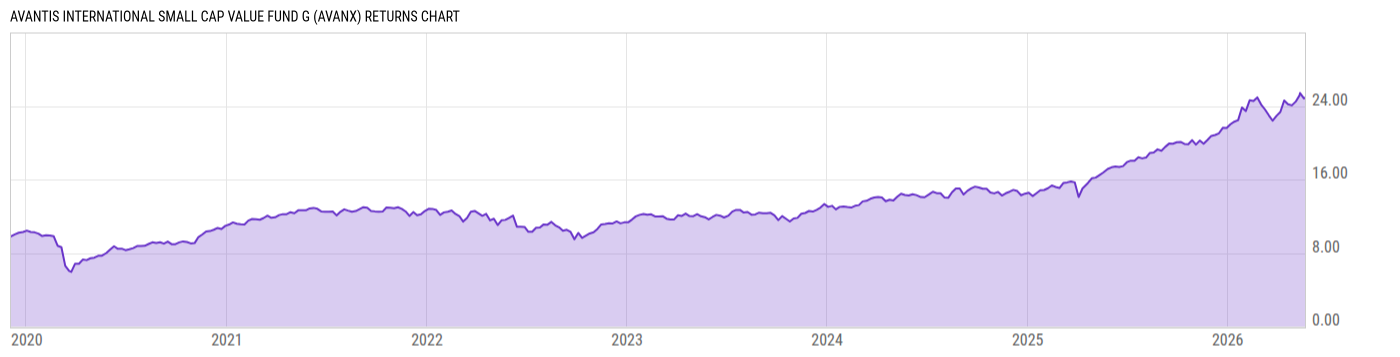
Avantis International Small Cap Value Fund G (AVANX)
18.44
-0.18
(-0.97%)
USD |
Jun 09 2026
Returns Chart
Key Stats
| Net Expense Ratio | Total Assets Under Management | Weighted Average Dividend Yield | Turnover Ratio (Generic) |
|---|---|---|---|
| 0.00% | 615.47M | 2.71% | 31.00% |
| 1 Year Fund Level Flows | 1 Year Total Returns (Daily) | Annualized Total Returns Since Inception (Daily) | Max Drawdown (Since Inception) |
| -109.70M | 39.10% |
Basic Info
| Investment Strategy | |
| The Fund seeks long-term capital appreciation. Under normal market conditions, the fund will invest at least 80% of its net assets in securities of non-US small capitalization companies, or companies whose capitalization is not greater than that of the largest company on the MSCI World ex USA Small Cap Index. |
| General | |
| Security Type | Mutual Fund |
| Equity Style | Small Cap Value |
| Broad Asset Class | International Equity |
| Broad Category | Equity |
| Global Peer Group | Equity Global ex US Sm&Mid Cap |
| Peer Group | International Small/Mid-Cap Value |
| Global Macro | Equity Global |
| US Macro | Developed International Markets Funds |
| YCharts Categorization | -- |
| YCharts Benchmark | -- |
| Prospectus Objective | International Small-Cap Funds |
| Fund Owner Firm Name | Avantis Investors |
| Broad Asset Class Benchmark Index | |
| ^MSACXUSNTR | 100.0% |
Net Fund Flows Versus Peer Group
1 Month
% Rank:
53
-282.12M
Peer Group Low
225.82M
Peer Group High
1 Year
% Rank:
86
-109.70M
-2.574B
Peer Group Low
5.312B
Peer Group High
3 Months
% Rank:
68
-375.39M
Peer Group Low
952.84M
Peer Group High
3 Years
% Rank:
33
-5.031B
Peer Group Low
8.938B
Peer Group High
6 Months
% Rank:
80
-1.278B
Peer Group Low
2.015B
Peer Group High
5 Years
% Rank:
25
-6.421B
Peer Group Low
11.20B
Peer Group High
YTD
% Rank:
77
-738.56M
Peer Group Low
1.834B
Peer Group High
10 Years
% Rank:
12
-10.98B
Peer Group Low
11.91B
Peer Group High
Date Unavailable
Risk
Performance Versus Peer Group
Annual Total Returns Versus Peers
As of June 10, 2026.
Asset Allocation
As of April 30, 2026.
| Type | % Net |
|---|---|
| Cash | 0.32% |
| Stock | 97.81% |
| Bond | 0.31% |
| Convertible | 0.00% |
| Preferred | 0.41% |
| Other | 1.14% |
Top 10 Holdings
| Name | % Weight | Price | % Change |
|---|---|---|---|
| State Street US Government Money Market Fund Prem | 0.79% | 1.00 | 0.00% |
| Perseus Mining Ltd. | 0.78% | 3.26 | -6.50% |
| OceanaGold Corp. | 0.74% | 25.03 | -4.28% |
| Whitehaven Coal Ltd. | 0.68% | 6.40 | -0.70% |
| Finning International, Inc. | 0.67% | 70.51 | -4.37% |
| AT & S Austria Technologie & Systemtechnik AG | 0.65% | 162.65 | 1.97% |
| Drax Group Plc | 0.64% | 10.00 | 0.00% |
| Regis Resources Ltd. | 0.63% | 4.10 | 0.00% |
| Coeur Mining, Inc. | 0.62% | 16.09 | -3.83% |
| Hudbay Minerals, Inc. | 0.62% | 25.59 | -1.99% |
Fees & Availability
| Fees | |
| Actual 12B-1 Fee | -- |
| Actual Management Fee | 0.00% |
| Administration Fee | -- |
| Maximum Front Load | -- |
| Maximum Deferred Load | -- |
| Maximum Redemption Fee | -- |
| General Availability | |
| Available for Insurance Product | No |
| Available for RRSP | No |
| Purchase Details | |
| Open to New Investors |
|
| Minimum Initial Investment | 0.00 None |
| Minimum Subsequent Investment | 0.00 None |
Basic Info
| Investment Strategy | |
| The Fund seeks long-term capital appreciation. Under normal market conditions, the fund will invest at least 80% of its net assets in securities of non-US small capitalization companies, or companies whose capitalization is not greater than that of the largest company on the MSCI World ex USA Small Cap Index. |
| General | |
| Security Type | Mutual Fund |
| Equity Style | Small Cap Value |
| Broad Asset Class | International Equity |
| Broad Category | Equity |
| Global Peer Group | Equity Global ex US Sm&Mid Cap |
| Peer Group | International Small/Mid-Cap Value |
| Global Macro | Equity Global |
| US Macro | Developed International Markets Funds |
| YCharts Categorization | -- |
| YCharts Benchmark | -- |
| Prospectus Objective | International Small-Cap Funds |
| Fund Owner Firm Name | Avantis Investors |
| Broad Asset Class Benchmark Index | |
| ^MSACXUSNTR | 100.0% |
Fundamentals
| General | |
| Distribution Yield | -- |
| Dividend Yield TTM (6-8-26) | 3.58% |
| 30-Day SEC Yield (7-31-23) | 0.00% |
| 7-Day SEC Yield | -- |
| Number of Holdings | 1450 |
| Stock | |
| Weighted Average PE Ratio | 19.79 |
| Weighted Average Price to Sales Ratio | 1.988 |
| Weighted Average Price to Book Ratio | 2.201 |
| Weighted Median ROE | 12.07% |
| Weighted Median ROA | 5.13% |
| ROI (TTM) | 8.76% |
| Return on Investment (TTM) | 8.76% |
| Earning Yield | 0.0728 |
| LT Debt / Shareholders Equity | 0.6708 |
| Number of Equity Holdings | 1425 |
As of April 30, 2026
Growth Metrics
| EPS Growth (1Y) | 20.48% |
| EPS Growth (3Y) | 12.11% |
| EPS Growth (5Y) | 18.84% |
| Sales Growth (1Y) | 10.06% |
| Sales Growth (3Y) | 8.29% |
| Sales Growth (5Y) | 11.17% |
| Sales per Share Growth (1Y) | 1.30K% |
| Sales per Share Growth (3Y) | 11.33% |
| Operating Cash Flow - Growth Rate (3Y) | 27.27% |
As of April 30, 2026
Fund Details
| Key Dates | |
| Inception Date | 1/20/2021 |
| Last Annual Report Date | 8/31/2025 |
| Last Prospectus Date | 1/1/2026 |
| Share Classes | |
| AVDVX | Inst |
| Attributes | |
| Index Fund | -- |
| Inverse Fund | No |
| Leveraged Fund | -- |
| Fund of Funds | No |
| Currency Hedged Fund | -- |
| Socially Responsible Fund | No |
Top Portfolio Holders
| Name | % Weight |
|---|---|
| Portfolio A | 5.00% |
| Portfolio B | 3.50% |
| Portfolio C | 2.25% |
Excel Add-In Codes
| Name: =YCI("M:AVANX", "name") |
| Broad Asset Class: =YCI("M:AVANX", "broad_asset_class") |
| Broad Category: =YCI("M:AVANX", "broad_category_group") |
| Prospectus Objective: =YCI("M:AVANX", "prospectus_objective") |
| To find the codes for any of our securities and financial metrics, see our Complete Excel Reference. |