

Water Island Credit Opportunities Fund R (ARCFX)
9.93
0.00 (0.00%)
USD |
Jun 09 2026
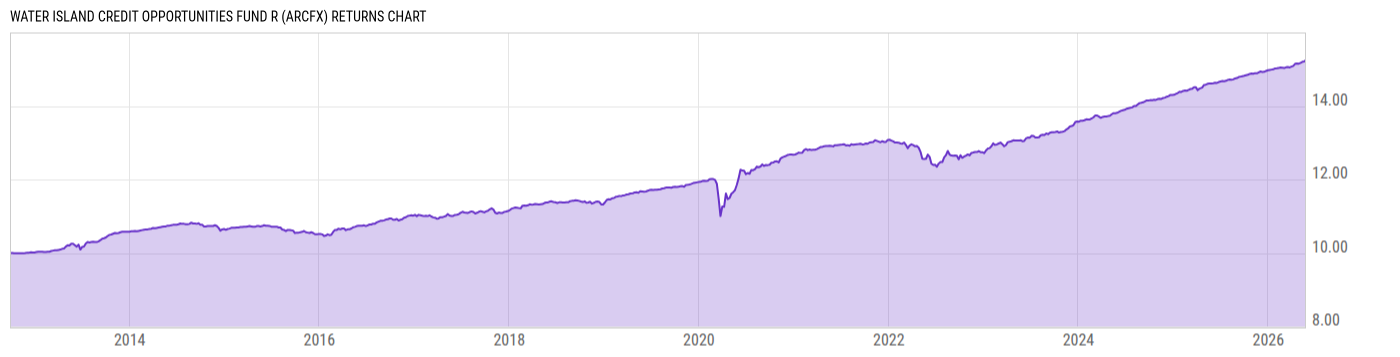
Returns Chart
Key Stats
| Net Expense Ratio | Total Assets Under Management | Weighted Average Dividend Yield | Turnover Ratio (Generic) |
|---|---|---|---|
| 1.27% | 168.98M | -- | 132.0% |
| 1 Year Fund Level Flows | 1 Year Total Returns (Daily) | Annualized Total Returns Since Inception (Daily) | Max Drawdown (Since Inception) |
| -2.704M | 4.30% |
Basic Info
| Investment Strategy | |
| The Fund seeks to provide current income and capital growth. The Fund invests in debt securities including corporate bonds and debentures, bank loans, convertible and preferred securities, credit default swaps and other debt instruments and derivatives that the Adviser believes have debt-like characteristics. |
| General | |
| Security Type | Mutual Fund |
| Equity Style | -- |
| Broad Asset Class | Taxable Bond |
| Broad Category | Alternative Strategies |
| Global Peer Group | Alternative Credit Focus |
| Peer Group | Alternative Credit Focus Funds |
| Global Macro | Alternative Bond |
| US Macro | Alternative Bond Funds |
| YCharts Categorization | -- |
| YCharts Benchmark | -- |
| Prospectus Objective | Alternative Credit Focus Funds |
| Fund Owner Firm Name | Arbitrage Funds |
| Broad Asset Class Benchmark Index | |
| ^BBUSATR | 100.0% |
Net Fund Flows Versus Peer Group
1 Month
% Rank:
41
-11.14M
Peer Group Low
168.46M
Peer Group High
1 Year
% Rank:
62
-2.704M
-914.98M
Peer Group Low
3.343B
Peer Group High
3 Months
% Rank:
34
-264.79M
Peer Group Low
869.06M
Peer Group High
3 Years
% Rank:
50
-703.80M
Peer Group Low
4.117B
Peer Group High
6 Months
% Rank:
37
-407.31M
Peer Group Low
2.256B
Peer Group High
5 Years
% Rank:
51
-1.870B
Peer Group Low
2.716B
Peer Group High
YTD
% Rank:
46
-301.59M
Peer Group Low
2.047B
Peer Group High
10 Years
% Rank:
45
-11.22B
Peer Group Low
6.503B
Peer Group High
Date Unavailable
Risk
Performance Versus Peer Group
Annual Total Returns Versus Peers
As of June 10, 2026.
Asset Allocation
As of February 28, 2026.
| Type | % Net |
|---|---|
| Cash | 5.03% |
| Stock | -7.68% |
| Bond | 93.89% |
| Convertible | 0.00% |
| Preferred | 0.00% |
| Other | 8.76% |
Top 10 Holdings
| Name | % Weight | Price | % Change |
|---|---|---|---|
|
Morgan Stanley Equity Swap
|
7.57% | -- | -- |
| Hologic, Inc. HOLX 02/15/2029 FIX USD Corporate 144A (Called) | 4.89% | 100.18 | -0.03% |
| Frontier Communications Holdings, LLC FRCOMM 05/15/2030 FIX USD Corporate 144A (Called) | 4.33% | 102.23 | 0.01% |
| Chart Industries, Inc. KZH-CIDI 7.5 01/01/2030 FIX USD Corporate 144A | 4.19% | 103.51 | -0.18% |
| EXACT SCIENCES CORPORATION EXACTSC 0.375 03/01/2028 FIX USD Corporate | 4.08% | 105.18 | 0.00% |
| Sealed Air Corporation SEE 02/01/2028 FIX USD Corporate 144A (Called) | 3.98% | 101.50 | 1.50% |
| CSG Systems International, Inc. CSGS 3.875 09/15/2028 FIX USD Corporate | 3.98% | 122.16 | 0.00% |
| State Street US Government Money Market Fund Prem | 3.90% | 1.00 | 0.00% |
| Morgan Stanley Inst Liq Govt Port Institutional | 3.90% | 1.00 | 0.00% |
| EchoStar Corporation ECHO 6.75 11/30/2030 FIX USD Corporate | 3.38% | 101.95 | 0.03% |
Fees & Availability
| Fees | |
| Actual 12B-1 Fee | 0.25% |
| Actual Management Fee | 0.58% |
| Administration Fee | 5.00K% |
| Maximum Front Load | -- |
| Maximum Deferred Load | -- |
| Maximum Redemption Fee | 0.00% |
| General Availability | |
| Available for Insurance Product | No |
| Available for RRSP | No |
| Purchase Details | |
| Open to New Investors |
|
| Minimum Initial Investment | 2000.00 None |
| Minimum Subsequent Investment | 0.00 None |
Basic Info
| Investment Strategy | |
| The Fund seeks to provide current income and capital growth. The Fund invests in debt securities including corporate bonds and debentures, bank loans, convertible and preferred securities, credit default swaps and other debt instruments and derivatives that the Adviser believes have debt-like characteristics. |
| General | |
| Security Type | Mutual Fund |
| Equity Style | -- |
| Broad Asset Class | Taxable Bond |
| Broad Category | Alternative Strategies |
| Global Peer Group | Alternative Credit Focus |
| Peer Group | Alternative Credit Focus Funds |
| Global Macro | Alternative Bond |
| US Macro | Alternative Bond Funds |
| YCharts Categorization | -- |
| YCharts Benchmark | -- |
| Prospectus Objective | Alternative Credit Focus Funds |
| Fund Owner Firm Name | Arbitrage Funds |
| Broad Asset Class Benchmark Index | |
| ^BBUSATR | 100.0% |
Fundamentals
| General | |
| Distribution Yield | -- |
| Dividend Yield TTM (6-8-26) | 3.60% |
| 30-Day SEC Yield | -- |
| 7-Day SEC Yield | -- |
| Number of Holdings | 58 |
| Stock | |
| Weighted Average PE Ratio | 45.92 |
| Weighted Average Price to Sales Ratio | 1.548 |
| Weighted Average Price to Book Ratio | 1.914 |
| Weighted Median ROE | 1.77% |
| Weighted Median ROA | 0.84% |
| ROI (TTM) | 1.27% |
| Return on Investment (TTM) | 1.27% |
| Earning Yield | 0.0235 |
| LT Debt / Shareholders Equity | 0.7512 |
| Number of Equity Holdings | 13 |
| Bond | |
| Yield to Maturity (2-28-26) | 4.51% |
| Effective Duration | 0.90 |
| Average Coupon | 4.39% |
| Calculated Average Quality | 5.312 |
| Effective Maturity | 2.827 |
| Nominal Maturity | 3.454 |
| Number of Bond Holdings | 37 |
As of February 28, 2026
Growth Metrics
| EPS Growth (1Y) | 39.61% |
| EPS Growth (3Y) | -20.30% |
| EPS Growth (5Y) | -2.78% |
| Sales Growth (1Y) | 6.40% |
| Sales Growth (3Y) | -2.55% |
| Sales Growth (5Y) | 5.55% |
| Sales per Share Growth (1Y) | 3.29% |
| Sales per Share Growth (3Y) | 17.51% |
| Operating Cash Flow - Growth Rate (3Y) | -1.97% |
As of February 28, 2026
Top Portfolio Holders
| Name | % Weight |
|---|---|
| Portfolio A | 5.00% |
| Portfolio B | 3.50% |
| Portfolio C | 2.25% |
Excel Add-In Codes
| Name: =YCI("M:ARCFX", "name") |
| Broad Asset Class: =YCI("M:ARCFX", "broad_asset_class") |
| Broad Category: =YCI("M:ARCFX", "broad_category_group") |
| Prospectus Objective: =YCI("M:ARCFX", "prospectus_objective") |
| To find the codes for any of our securities and financial metrics, see our Complete Excel Reference. |