

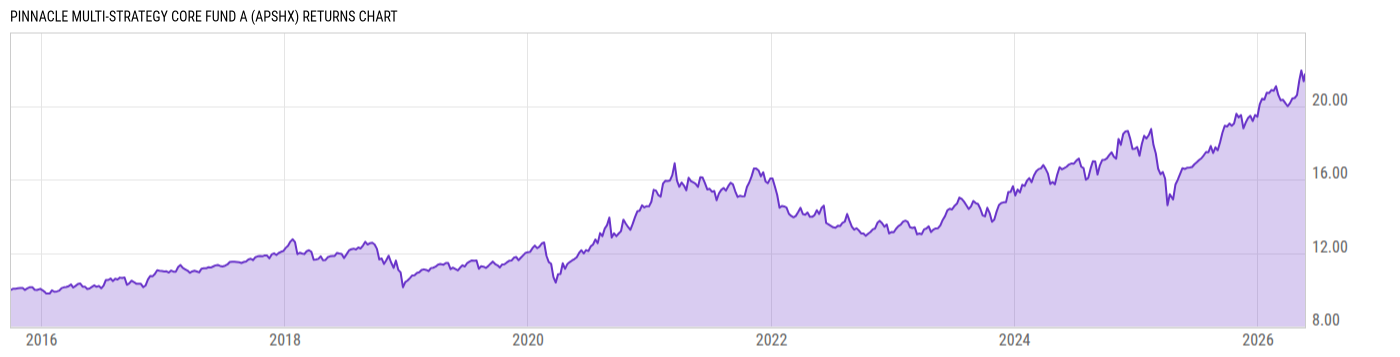
Pinnacle Multi-Strategy Core Fund A (APSHX)
15.26
-0.13
(-0.84%)
USD |
Jun 09 2026
Returns Chart
Key Stats
| Net Expense Ratio | Total Assets Under Management | Weighted Average Dividend Yield | Turnover Ratio (Generic) |
|---|---|---|---|
| 1.80% | 29.81M | -- | 350.0% |
| 1 Year Fund Level Flows | 1 Year Total Returns (Daily) | Annualized Total Returns Since Inception (Daily) | Max Drawdown (Since Inception) |
| -10.76M | 28.13% |
Basic Info
| Investment Strategy | |
| The Fund seeks high total return with reasonable risk. It invests in all major asset class including but not limited to foreign and domestic equity securities of all market capitalization, fixed income security of any credit quality & cash and cash equivalents. The Fund intends to generally invest in a mix of asset class. |
| General | |
| Security Type | Mutual Fund |
| Equity Style | -- |
| Broad Asset Class | Miscellaneous |
| Broad Category | Allocation |
| Global Peer Group | Mixed Asset USD Flexible - Global |
| Peer Group | Global Allocation Funds |
| Global Macro | Mixed Asset HC Flexible |
| US Macro | -- |
| YCharts Categorization | -- |
| YCharts Benchmark | -- |
| Prospectus Objective | -- |
| Fund Owner Firm Name | Pinnacle Dynamic Funds |
| Broad Asset Class Benchmark Index | |
| ^SPXTR | 100.0% |
Net Fund Flows Versus Peer Group
1 Month
% Rank:
49
-241.94M
Peer Group Low
215.67M
Peer Group High
1 Year
% Rank:
49
-10.76M
-2.020B
Peer Group Low
2.604B
Peer Group High
3 Months
% Rank:
46
-500.74M
Peer Group Low
588.68M
Peer Group High
3 Years
% Rank:
28
-7.472B
Peer Group Low
4.368B
Peer Group High
6 Months
% Rank:
50
-1.280B
Peer Group Low
1.417B
Peer Group High
5 Years
% Rank:
31
-13.61B
Peer Group Low
5.159B
Peer Group High
YTD
% Rank:
49
-722.86M
Peer Group Low
1.186B
Peer Group High
10 Years
% Rank:
46
-46.97B
Peer Group Low
7.803B
Peer Group High
Date Unavailable
Risk
Performance Versus Peer Group
Annual Total Returns Versus Peers
As of June 10, 2026.
Asset Allocation
As of March 31, 2026.
| Type | % Net |
|---|---|
| Cash | 13.99% |
| Stock | 27.34% |
| Bond | 49.25% |
| Convertible | 0.00% |
| Preferred | 0.00% |
| Other | 9.42% |
Top 10 Holdings
| Name | % Weight | Price | % Change |
|---|---|---|---|
| State Street SPDR Bloomberg 1-3 Month T-Bill ETF | 34.07% | 91.46 | 0.00% |
| First American Government Obligations Fd X | 24.46% | 1.00 | 0.00% |
| Pinnacle Focused Opportunities ETF | 18.31% | 42.84 | -2.65% |
|
Other Assets less Liabilities
|
8.68% | -- | -- |
| State Street SPDR S&P 500 ETF Trust | 8.32% | 737.05 | -0.29% |
| First Tr Morningstar Dividend Leaders Index Fund | 1.41% | 50.25 | 0.12% |
| Arrow Dow Jones Global Yield ETF | 1.36% | 14.16 | 0.14% |
| State Street SPDR S&P Oil & Gas Expl & Prod ETF | 0.95% | 164.05 | -2.58% |
| State Street Energy Select Sector SPDR ETF | 0.95% | 57.39 | -1.61% |
| State Street Utilities Select Sector SPDR ETF | 0.94% | 43.98 | 1.06% |
Fees & Availability
| Fees | |
| Actual 12B-1 Fee | 0.25% |
| Actual Management Fee | 0.48% |
| Administration Fee | 8.98K% |
| Maximum Front Load | 5.75% |
| Maximum Deferred Load | -- |
| Maximum Redemption Fee | 1.00% |
| General Availability | |
| Available for Insurance Product | No |
| Available for RRSP | No |
| Purchase Details | |
| Open to New Investors |
|
| Minimum Initial Investment | 2000.00 None |
| Minimum Subsequent Investment | 500.00 None |
Basic Info
| Investment Strategy | |
| The Fund seeks high total return with reasonable risk. It invests in all major asset class including but not limited to foreign and domestic equity securities of all market capitalization, fixed income security of any credit quality & cash and cash equivalents. The Fund intends to generally invest in a mix of asset class. |
| General | |
| Security Type | Mutual Fund |
| Equity Style | -- |
| Broad Asset Class | Miscellaneous |
| Broad Category | Allocation |
| Global Peer Group | Mixed Asset USD Flexible - Global |
| Peer Group | Global Allocation Funds |
| Global Macro | Mixed Asset HC Flexible |
| US Macro | -- |
| YCharts Categorization | -- |
| YCharts Benchmark | -- |
| Prospectus Objective | -- |
| Fund Owner Firm Name | Pinnacle Dynamic Funds |
| Broad Asset Class Benchmark Index | |
| ^SPXTR | 100.0% |
Fundamentals
| General | |
| Distribution Yield | -- |
| Dividend Yield TTM (6-8-26) | 0.20% |
| 30-Day SEC Yield | -- |
| 7-Day SEC Yield | -- |
| Number of Holdings | 11 |
| Stock | |
| Weighted Average PE Ratio | 37.05 |
| Weighted Average Price to Sales Ratio | 8.345 |
| Weighted Average Price to Book Ratio | 10.44 |
| Weighted Median ROE | 38.59% |
| Weighted Median ROA | 8.54% |
| ROI (TTM) | 12.34% |
| Return on Investment (TTM) | 12.34% |
| Earning Yield | 0.0361 |
| LT Debt / Shareholders Equity | 0.9771 |
| Number of Equity Holdings | 0 |
| Bond | |
| Yield to Maturity (3-31-26) | 3.75% |
| Effective Duration | -- |
| Average Coupon | 7.32% |
| Calculated Average Quality | 4.946 |
| Effective Maturity | 0.3157 |
| Nominal Maturity | 0.3158 |
| Number of Bond Holdings | 0 |
As of March 31, 2026
Growth Metrics
| EPS Growth (1Y) | 36.57% |
| EPS Growth (3Y) | 2.66% |
| EPS Growth (5Y) | 15.30% |
| Sales Growth (1Y) | 19.55% |
| Sales Growth (3Y) | 7.70% |
| Sales Growth (5Y) | 12.12% |
| Sales per Share Growth (1Y) | 14.60% |
| Sales per Share Growth (3Y) | 6.08% |
| Operating Cash Flow - Growth Rate (3Y) | 18.97% |
As of March 31, 2026
Top Portfolio Holders
| Name | % Weight |
|---|---|
| Portfolio A | 5.00% |
| Portfolio B | 3.50% |
| Portfolio C | 2.25% |
Excel Add-In Codes
| Name: =YCI("M:APSHX", "name") |
| Broad Asset Class: =YCI("M:APSHX", "broad_asset_class") |
| Broad Category: =YCI("M:APSHX", "broad_category_group") |
| Prospectus Objective: =YCI("M:APSHX", "prospectus_objective") |
| To find the codes for any of our securities and financial metrics, see our Complete Excel Reference. |