

Yorktown Bond Fund Institutional (APIIX)
9.16
+0.01
(+0.11%)
USD |
Jun 09 2026
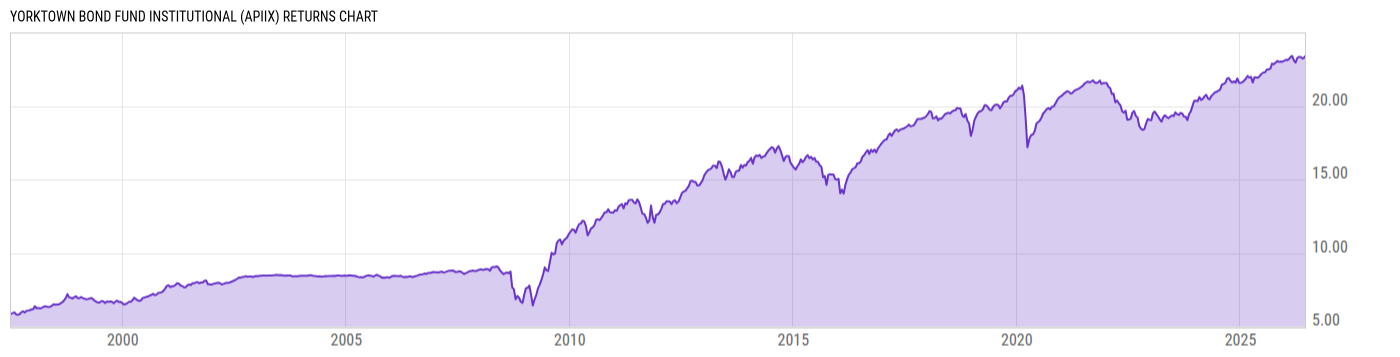
Returns Chart
Key Stats
| Net Expense Ratio | Total Assets Under Management | Weighted Average Dividend Yield | Turnover Ratio (Generic) |
|---|---|---|---|
| 0.65% | 348.66M | -- | 46.00% |
| 1 Year Fund Level Flows | 1 Year Total Returns (Daily) | Annualized Total Returns Since Inception (Daily) | Max Drawdown (Since Inception) |
| -22.11M | 5.58% |
Basic Info
| Investment Strategy | |
| The Fund seeks current income with limited credit risk. The Fund utilizes a flexible strategy in the selection of investments and is not limited by investment style or asset class. The Fund may invest in debt securities, common stock of U.S. and foreign issuers and in other U.S. and foreign securities. |
| General | |
| Security Type | Mutual Fund |
| Equity Style | -- |
| Broad Asset Class | Taxable Bond |
| Broad Category | Fixed Income |
| Global Peer Group | Bond USD |
| Peer Group | General Bond Funds |
| Global Macro | Bond HC |
| US Macro | General Domestic Taxable Fixed Income Funds |
| YCharts Categorization | -- |
| YCharts Benchmark | -- |
| Prospectus Objective | General Bond Funds |
| Fund Owner Firm Name | Yorktown |
| Broad Asset Class Benchmark Index | |
| ^BBUSATR | 100.0% |
Net Fund Flows Versus Peer Group
1 Month
% Rank:
70
-3.511B
Peer Group Low
3.098B
Peer Group High
1 Year
% Rank:
79
-22.11M
-647.01M
Peer Group Low
13.23B
Peer Group High
3 Months
% Rank:
79
-2.241B
Peer Group Low
3.962B
Peer Group High
3 Years
% Rank:
60
-12.70B
Peer Group Low
18.00B
Peer Group High
6 Months
% Rank:
75
-3.515B
Peer Group Low
5.649B
Peer Group High
5 Years
% Rank:
87
-1.461B
Peer Group Low
49.86B
Peer Group High
YTD
% Rank:
67
-2.086B
Peer Group Low
5.100B
Peer Group High
10 Years
% Rank:
93
-1.866B
Peer Group Low
81.23B
Peer Group High
Date Unavailable
Risk
Performance Versus Peer Group
Annual Total Returns Versus Peers
As of June 10, 2026.
Asset Allocation
As of March 31, 2026.
| Type | % Net |
|---|---|
| Cash | 5.62% |
| Stock | 0.05% |
| Bond | 93.29% |
| Convertible | 0.02% |
| Preferred | 0.22% |
| Other | 0.80% |
Top 10 Holdings
| Name | % Weight | Price | % Change |
|---|---|---|---|
|
Time/Term Deposits General Security
|
5.49% | -- | -- |
| United States of America USGB 4.875 10/31/2028 FIX USD Government | 0.85% | 101.59 | 0.07% |
|
Other Assets less Liabilities
|
0.73% | -- | -- |
|
Federal Home Loan Mortgage Corp 01-FEB-2055 SD8506
|
0.70% | -- | -- |
| HP Inc. HPINCAA 6.0 09/15/2041 FIX USD Corporate | 0.69% | 101.24 | 0.31% |
|
Federal National Mortgage Association 01-APR-2056 MA6029
|
0.68% | -- | -- |
| United States of America USGB 4.0 02/15/2034 FIX USD Government | 0.68% | 97.20 | 0.24% |
|
Federal National Mortgage Association 01-OCT-2055 MA5853
|
0.67% | -- | -- |
|
Federal Home Loan Mortgage Corp 01-SEP-2055 RQ0048
|
0.67% | -- | -- |
|
Federal Home Loan Mortgage Corp 01-DEC-2053 SD8383
|
0.66% | -- | -- |
Fees & Availability
| Fees | |
| Actual 12B-1 Fee | -- |
| Actual Management Fee | 0.40% |
| Administration Fee | -- |
| Maximum Front Load | -- |
| Maximum Deferred Load | -- |
| Maximum Redemption Fee | -- |
| General Availability | |
| Available for Insurance Product | No |
| Available for RRSP | No |
| Purchase Details | |
| Open to New Investors |
|
| Minimum Initial Investment | 1.00M None |
| Minimum Subsequent Investment | 100000.0 None |
Basic Info
| Investment Strategy | |
| The Fund seeks current income with limited credit risk. The Fund utilizes a flexible strategy in the selection of investments and is not limited by investment style or asset class. The Fund may invest in debt securities, common stock of U.S. and foreign issuers and in other U.S. and foreign securities. |
| General | |
| Security Type | Mutual Fund |
| Equity Style | -- |
| Broad Asset Class | Taxable Bond |
| Broad Category | Fixed Income |
| Global Peer Group | Bond USD |
| Peer Group | General Bond Funds |
| Global Macro | Bond HC |
| US Macro | General Domestic Taxable Fixed Income Funds |
| YCharts Categorization | -- |
| YCharts Benchmark | -- |
| Prospectus Objective | General Bond Funds |
| Fund Owner Firm Name | Yorktown |
| Broad Asset Class Benchmark Index | |
| ^BBUSATR | 100.0% |
Fundamentals
| General | |
| Distribution Yield | -- |
| Dividend Yield TTM (6-8-26) | 4.36% |
| 30-Day SEC Yield (6-30-17) | 5.88% |
| 7-Day SEC Yield | -- |
| Number of Holdings | 323 |
| Bond | |
| Yield to Maturity (3-31-26) | 5.38% |
| Effective Duration | 4.30 |
| Average Coupon | 5.20% |
| Calculated Average Quality | 3.589 |
| Effective Maturity | 16.60 |
| Nominal Maturity | 18.88 |
| Number of Bond Holdings | 313 |
As of March 31, 2026
Fund Details
Top Portfolio Holders
| Name | % Weight |
|---|---|
| Portfolio A | 5.00% |
| Portfolio B | 3.50% |
| Portfolio C | 2.25% |
Excel Add-In Codes
| Name: =YCI("M:APIIX", "name") |
| Broad Asset Class: =YCI("M:APIIX", "broad_asset_class") |
| Broad Category: =YCI("M:APIIX", "broad_category_group") |
| Prospectus Objective: =YCI("M:APIIX", "prospectus_objective") |
| To find the codes for any of our securities and financial metrics, see our Complete Excel Reference. |