

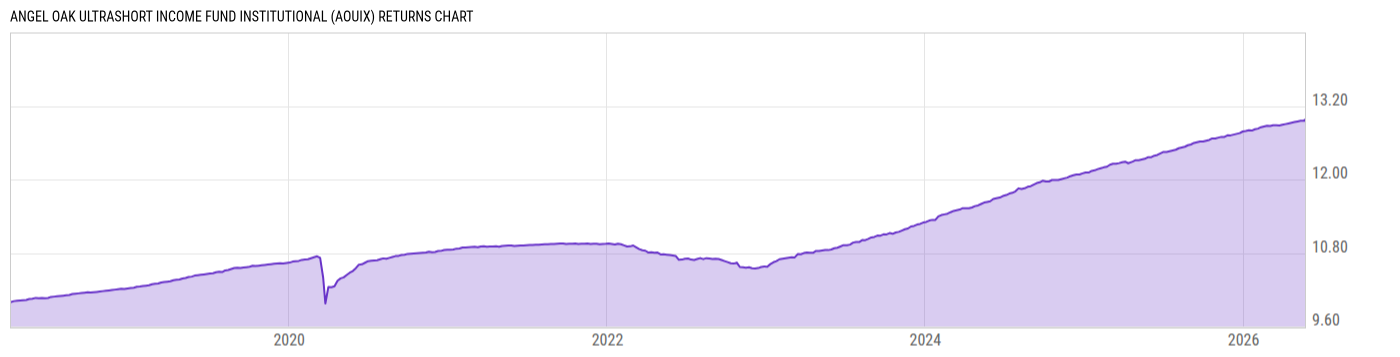
Angel Oak UltraShort Income Fund Institutional (AOUIX)
9.86
+0.01
(+0.10%)
USD |
Jun 09 2026
Returns Chart
Key Stats
| Net Expense Ratio | Total Assets Under Management | Weighted Average Dividend Yield | Turnover Ratio (Generic) |
|---|---|---|---|
| 0.35% | 832.71M | -- | 76.00% |
| 1 Year Fund Level Flows | 1 Year Total Returns (Daily) | Annualized Total Returns Since Inception (Daily) | Max Drawdown (Since Inception) |
| 163.24M | 4.97% |
Basic Info
| Investment Strategy | |
| The Fund seeks to provide current income while seeking to minimize price volatility and maintain liquidity. The Fund invests in mortgage-backed and other asset-backed fixed income securities, corporate and other debt securities, and collateralized loan obligations and other collateralized debt obligations. |
| General | |
| Security Type | Mutual Fund |
| Equity Style | -- |
| Broad Asset Class | Taxable Bond |
| Broad Category | Fixed Income |
| Global Peer Group | Bond USD |
| Peer Group | Multi-Sector Income Funds |
| Global Macro | Bond HC |
| US Macro | General Domestic Taxable Fixed Income Funds |
| YCharts Categorization | -- |
| YCharts Benchmark | -- |
| Prospectus Objective | Multi-Sector Income Funds |
| Fund Owner Firm Name | Angel Oak Funds |
| Broad Asset Class Benchmark Index | |
| ^BBUSATR | 100.0% |
Net Fund Flows Versus Peer Group
1 Month
% Rank:
25
-144.76M
Peer Group Low
572.86M
Peer Group High
1 Year
% Rank:
31
163.24M
-1.545B
Peer Group Low
30.94B
Peer Group High
3 Months
% Rank:
36
-480.71M
Peer Group Low
1.683B
Peer Group High
3 Years
% Rank:
36
-4.573B
Peer Group Low
71.08B
Peer Group High
6 Months
% Rank:
32
-777.58M
Peer Group Low
12.53B
Peer Group High
5 Years
% Rank:
75
-7.509B
Peer Group Low
61.00B
Peer Group High
YTD
% Rank:
39
-627.92M
Peer Group Low
8.773B
Peer Group High
10 Years
% Rank:
31
-13.91B
Peer Group Low
116.77B
Peer Group High
Date Unavailable
Risk
Performance Versus Peer Group
Annual Total Returns Versus Peers
As of June 10, 2026.
Asset Allocation
As of March 31, 2026.
| Type | % Net |
|---|---|
| Cash | -0.01% |
| Stock | 0.00% |
| Bond | 99.84% |
| Convertible | 0.00% |
| Preferred | 0.00% |
| Other | 0.17% |
Top 10 Holdings
| Name | % Weight | Price | % Change |
|---|---|---|---|
| First American Government Obligations Fd U | 1.90% | 1.00 | 0.00% |
|
BAIN CAPITAL CREDIT CLO 205RR ARR FLT 5.03444% 20-APR-2034
|
1.35% | -- | -- |
|
CIFC FUNDING LTD 201R A1R FLT 5.31615% 15-JUL-2036
|
1.28% | -- | -- |
| FHLMC-New 0.273 12/25/2030 FIX USD Agency | 1.04% | 99.21 | 0.00% |
| FHLMC-New 0.26 12/25/2028 FIX USD Agency | 1.00% | 99.62 | 0.00% |
| FHLMC-New 0.242 01/25/2031 FIX USD Agency | 1.00% | 99.21 | 0.00% |
|
BLACKROCK DLF.LLC 25C A FLT 21-NOV-2033
|
0.99% | -- | -- |
| FHLMC-New 0.569 03/25/2032 FIX USD Agency | 0.98% | 99.94 | 0.01% |
|
PAGAYA AI DEBT GRANTOR TRUST 257 A2 FIX 4.529% 15-MAY-2033
|
0.87% | -- | -- |
| FHLMC-New 0.25 08/25/2031 FIX USD Agency | 0.84% | 99.10 | 0.00% |
Fees & Availability
| Fees | |
| Actual 12B-1 Fee | -- |
| Actual Management Fee | 0.24% |
| Administration Fee | 115.2K% |
| Maximum Front Load | -- |
| Maximum Deferred Load | -- |
| Maximum Redemption Fee | -- |
| General Availability | |
| Available for Insurance Product | No |
| Available for RRSP | No |
| Purchase Details | |
| Open to New Investors |
|
| Minimum Initial Investment | 500000.0 None |
| Minimum Subsequent Investment | 100.00 None |
Basic Info
| Investment Strategy | |
| The Fund seeks to provide current income while seeking to minimize price volatility and maintain liquidity. The Fund invests in mortgage-backed and other asset-backed fixed income securities, corporate and other debt securities, and collateralized loan obligations and other collateralized debt obligations. |
| General | |
| Security Type | Mutual Fund |
| Equity Style | -- |
| Broad Asset Class | Taxable Bond |
| Broad Category | Fixed Income |
| Global Peer Group | Bond USD |
| Peer Group | Multi-Sector Income Funds |
| Global Macro | Bond HC |
| US Macro | General Domestic Taxable Fixed Income Funds |
| YCharts Categorization | -- |
| YCharts Benchmark | -- |
| Prospectus Objective | Multi-Sector Income Funds |
| Fund Owner Firm Name | Angel Oak Funds |
| Broad Asset Class Benchmark Index | |
| ^BBUSATR | 100.0% |
Fundamentals
| General | |
| Distribution Yield | -- |
| Dividend Yield TTM (6-8-26) | 4.79% |
| 30-Day SEC Yield (5-31-26) | 4.51% |
| 7-Day SEC Yield | -- |
| Number of Holdings | 450 |
| Bond | |
| Yield to Maturity (3-31-26) | 4.67% |
| Effective Duration | 0.80 |
| Average Coupon | 4.77% |
| Calculated Average Quality | 2.582 |
| Effective Maturity | 8.691 |
| Nominal Maturity | 8.741 |
| Number of Bond Holdings | 423 |
As of March 31, 2026
Fund Details
Top Portfolio Holders
| Name | % Weight |
|---|---|
| Portfolio A | 5.00% |
| Portfolio B | 3.50% |
| Portfolio C | 2.25% |
Excel Add-In Codes
| Name: =YCI("M:AOUIX", "name") |
| Broad Asset Class: =YCI("M:AOUIX", "broad_asset_class") |
| Broad Category: =YCI("M:AOUIX", "broad_category_group") |
| Prospectus Objective: =YCI("M:AOUIX", "prospectus_objective") |
| To find the codes for any of our securities and financial metrics, see our Complete Excel Reference. |