

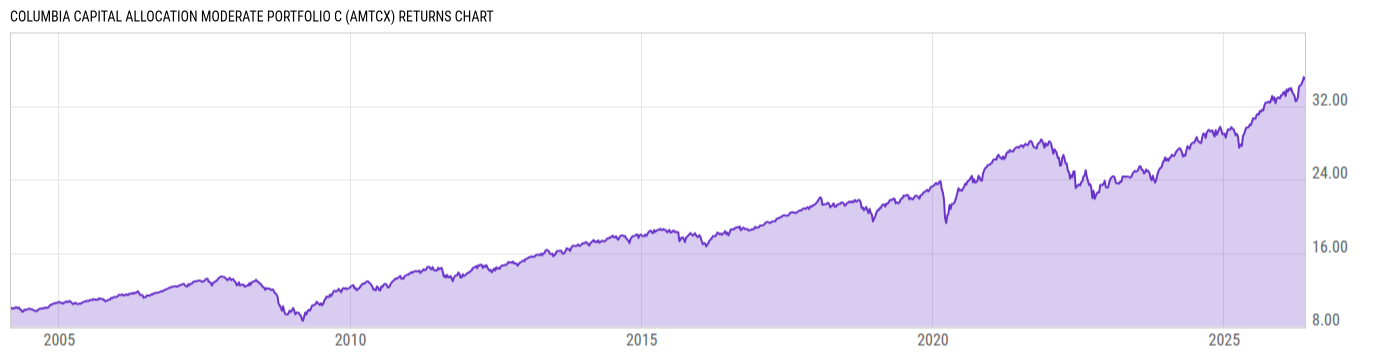
Columbia Capital Allocation Moderate Portfolio C (AMTCX)
11.93
+0.01
(+0.08%)
USD |
May 22 2026
Returns Chart
Key Stats
| Net Expense Ratio | Total Assets Under Management | Weighted Average Dividend Yield | Turnover Ratio (Generic) |
|---|---|---|---|
| 1.13% | 1.067B | -- | 24.00% |
| 1 Year Fund Level Flows | 1 Year Total Returns (Daily) | Annualized Total Returns Since Inception (Daily) | Max Drawdown (Since Inception) |
| -124.47M | 19.17% |
Basic Info
| Investment Strategy | |
| The Fund seeks a high level of total return consistent with a moderate level of risk, by investing in a balance of fixed income and equity securities. |
| General | |
| Security Type | Mutual Fund |
| Equity Style | -- |
| Broad Asset Class | Allocation |
| Broad Category | Allocation |
| Global Peer Group | Mixed Asset USD Balanced - US |
| Peer Group | Mixed-Asset Target Alloc Moderate Funds |
| Global Macro | Mixed Asset HC Balanced |
| US Macro | Mixed-Assets Target Allocation Funds |
| YCharts Categorization | -- |
| YCharts Benchmark | -- |
| Prospectus Objective | Balanced Funds |
| Fund Owner Firm Name | Columbia Threadneedle Investments |
| Broad Asset Class Benchmark Index | |
| ^SPXTR | 100.0% |
Net Fund Flows Versus Peer Group
1 Month
% Rank:
63
-259.73M
Peer Group Low
518.99M
Peer Group High
1 Year
% Rank:
66
-124.47M
-5.437B
Peer Group Low
654.25M
Peer Group High
3 Months
% Rank:
64
-1.199B
Peer Group Low
597.16M
Peer Group High
3 Years
% Rank:
69
-21.54B
Peer Group Low
3.106B
Peer Group High
6 Months
% Rank:
64
-3.694B
Peer Group Low
582.67M
Peer Group High
5 Years
% Rank:
71
-30.31B
Peer Group Low
2.725B
Peer Group High
YTD
% Rank:
63
-1.525B
Peer Group Low
591.77M
Peer Group High
10 Years
% Rank:
69
-51.28B
Peer Group Low
3.796B
Peer Group High
Date Unavailable
Risk
Performance Versus Peer Group
Annual Total Returns Versus Peers
As of May 23, 2026.
Asset Allocation
As of March 31, 2026.
| Type | % Net |
|---|---|
| Cash | 2.59% |
| Stock | 25.00% |
| Bond | 9.06% |
| Convertible | 0.00% |
| Preferred | 0.18% |
| Other | 63.17% |
Top 10 Holdings
| Name | % Weight | Price | % Change |
|---|---|---|---|
|
COLUMBIA BOND CL I3 MF
|
19.24% | -- | -- |
| Columbia Contrarian Core Fund I3 | 10.12% | 42.96 | 0.37% |
|
COLUMBIA CORNERSTONE EQUITY CL I3 MF
|
10.07% | -- | -- |
| Columbia Overseas Core Fund Institutional 3 | 9.77% | 13.44 | -0.07% |
|
COLUMBIA CORNERSTONE CL I3 MF
|
9.48% | -- | -- |
|
CLMBA INTRINSIC VALUE CL I3 MF
|
9.08% | -- | -- |
|
CLMBA SELECT CORPORATE CL I3 MF
|
7.30% | -- | -- |
| Columbia High Yield Bond Fund I3 | 4.26% | 11.07 | 0.09% |
|
COLUMBIA MULTI STRATEGY ALT CL I MF
|
3.85% | -- | -- |
|
COLUMBIA QLTY INCM CL I3 MF
|
3.77% | -- | -- |
Fees & Availability
| Fees | |
| Actual 12B-1 Fee | 1.00% |
| Actual Management Fee | 0.03% |
| Administration Fee | -- |
| Maximum Front Load | -- |
| Maximum Deferred Load | 1.00% |
| Maximum Redemption Fee | -- |
| General Availability | |
| Available for Insurance Product | No |
| Available for RRSP | No |
| Purchase Details | |
| Open to New Investors |
|
| Minimum Initial Investment | 2000.00 None |
| Minimum Subsequent Investment | 0.00 None |
Basic Info
| Investment Strategy | |
| The Fund seeks a high level of total return consistent with a moderate level of risk, by investing in a balance of fixed income and equity securities. |
| General | |
| Security Type | Mutual Fund |
| Equity Style | -- |
| Broad Asset Class | Allocation |
| Broad Category | Allocation |
| Global Peer Group | Mixed Asset USD Balanced - US |
| Peer Group | Mixed-Asset Target Alloc Moderate Funds |
| Global Macro | Mixed Asset HC Balanced |
| US Macro | Mixed-Assets Target Allocation Funds |
| YCharts Categorization | -- |
| YCharts Benchmark | -- |
| Prospectus Objective | Balanced Funds |
| Fund Owner Firm Name | Columbia Threadneedle Investments |
| Broad Asset Class Benchmark Index | |
| ^SPXTR | 100.0% |
Fundamentals
| General | |
| Distribution Yield | -- |
| Dividend Yield TTM (5-21-26) | 1.80% |
| 30-Day SEC Yield | -- |
| 7-Day SEC Yield | -- |
| Number of Holdings | 10 |
| Stock | |
| Weighted Average PE Ratio | 26.46 |
| Weighted Average Price to Sales Ratio | 5.872 |
| Weighted Average Price to Book Ratio | 6.523 |
| Weighted Median ROE | 60.87% |
| Weighted Median ROA | 11.45% |
| ROI (TTM) | 17.24% |
| Return on Investment (TTM) | 17.24% |
| Earning Yield | 0.0509 |
| LT Debt / Shareholders Equity | 0.6349 |
| Number of Equity Holdings | 0 |
| Bond | |
| Yield to Maturity (3-31-26) | 5.24% |
| Effective Duration | -- |
| Average Coupon | 5.45% |
| Calculated Average Quality | 4.334 |
| Effective Maturity | 7.095 |
| Nominal Maturity | 7.320 |
| Number of Bond Holdings | 0 |
As of March 31, 2026
Growth Metrics
| EPS Growth (1Y) | 24.27% |
| EPS Growth (3Y) | 17.10% |
| EPS Growth (5Y) | 20.99% |
| Sales Growth (1Y) | 15.82% |
| Sales Growth (3Y) | 13.88% |
| Sales Growth (5Y) | 14.85% |
| Sales per Share Growth (1Y) | 16.06% |
| Sales per Share Growth (3Y) | 13.98% |
| Operating Cash Flow - Growth Rate (3Y) | 24.71% |
As of March 31, 2026
Top Portfolio Holders
| Name | % Weight |
|---|---|
| Portfolio A | 5.00% |
| Portfolio B | 3.50% |
| Portfolio C | 2.25% |
Excel Add-In Codes
| Name: =YCI("M:AMTCX", "name") |
| Broad Asset Class: =YCI("M:AMTCX", "broad_asset_class") |
| Broad Category: =YCI("M:AMTCX", "broad_category_group") |
| Prospectus Objective: =YCI("M:AMTCX", "prospectus_objective") |
| To find the codes for any of our securities and financial metrics, see our Complete Excel Reference. |