

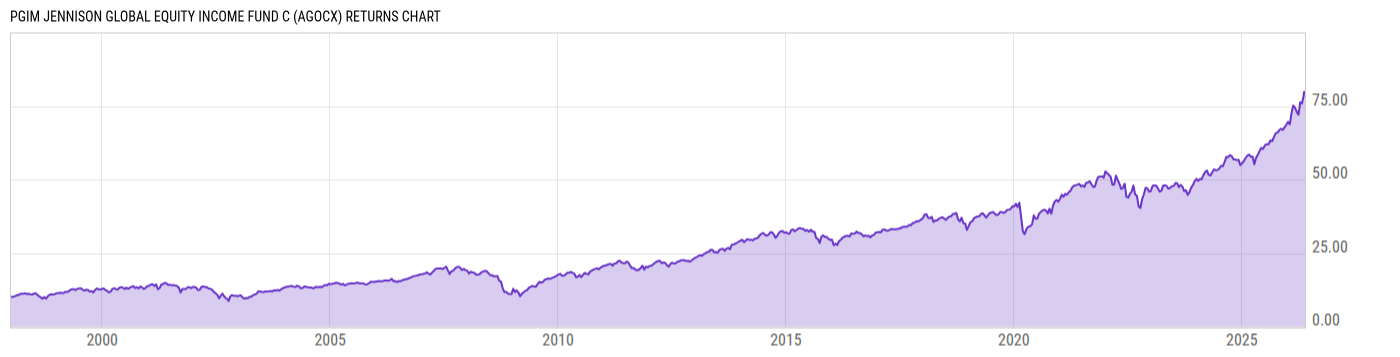
PGIM Jennison Global Equity Income Fund C (AGOCX)
14.63
+0.03
(+0.21%)
USD |
Jun 09 2026
Returns Chart
Key Stats
| Net Expense Ratio | Total Assets Under Management | Weighted Average Dividend Yield | Turnover Ratio (Generic) |
|---|---|---|---|
| 2.12% | 853.41M | 2.92% | 5.00% |
| 1 Year Fund Level Flows | 1 Year Total Returns (Daily) | Annualized Total Returns Since Inception (Daily) | Max Drawdown (Since Inception) |
| -83.92M | 30.80% |
Basic Info
| Investment Strategy | |
| The Fund seeks income and capital appreciation. The Fund invests at least 65% of its total assets in income-producing equity and equity-related securities. The Fund seeks companies with the ability to sustain and/or grow their dividends. The Fund may also participate in the initial public offering market. |
| General | |
| Security Type | Mutual Fund |
| Equity Style | Large Cap Value |
| Broad Asset Class | International Equity |
| Broad Category | Equity |
| Global Peer Group | Equity Global Income |
| Peer Group | Global Equity Income Funds |
| Global Macro | Equity Global |
| US Macro | Developed Global Markets Funds |
| YCharts Categorization | -- |
| YCharts Benchmark | -- |
| Prospectus Objective | Global Funds |
| Fund Owner Firm Name | PGIM |
| Broad Asset Class Benchmark Index | |
| ^MSACXUSNTR | 100.0% |
Net Fund Flows Versus Peer Group
1 Month
% Rank:
65
-382.05M
Peer Group Low
2.871B
Peer Group High
1 Year
% Rank:
69
-83.92M
-5.337B
Peer Group Low
2.871B
Peer Group High
3 Months
% Rank:
69
-938.28M
Peer Group Low
2.871B
Peer Group High
3 Years
% Rank:
67
-20.01B
Peer Group Low
4.253B
Peer Group High
6 Months
% Rank:
69
-3.422B
Peer Group Low
2.871B
Peer Group High
5 Years
% Rank:
69
-27.17B
Peer Group Low
4.253B
Peer Group High
YTD
% Rank:
69
-1.912B
Peer Group Low
2.871B
Peer Group High
10 Years
% Rank:
73
-54.86B
Peer Group Low
4.253B
Peer Group High
Date Unavailable
Risk
Performance Versus Peer Group
Annual Total Returns Versus Peers
As of June 10, 2026.
Asset Allocation
As of April 30, 2026.
| Type | % Net |
|---|---|
| Cash | 0.04% |
| Stock | 97.09% |
| Bond | 0.00% |
| Convertible | 0.00% |
| Preferred | 1.80% |
| Other | 1.07% |
Top 10 Holdings
| Name | % Weight | Price | % Change |
|---|---|---|---|
| AXA SA | 4.85% | 46.70 | 3.09% |
| Caterpillar, Inc. | 4.74% | 914.70 | -0.10% |
| National Grid Plc | 4.72% | 16.25 | 3.97% |
| Lam Research Corp. | 4.69% | 327.16 | 0.84% |
| Enel SpA | 4.23% | 11.00 | -5.17% |
| AbbVie, Inc. | 4.03% | 225.42 | 1.05% |
| Zurich Insurance Group AG | 3.82% | 700.00 | 1.45% |
| Broadcom Inc. | 3.80% | 392.16 | -1.12% |
| Enbridge, Inc. | 3.56% | 55.54 | 0.38% |
| Corning, Inc. | 3.50% | 173.94 | -7.25% |
Fees & Availability
| Fees | |
| Actual 12B-1 Fee | 1.00% |
| Actual Management Fee | 0.74% |
| Administration Fee | -- |
| Maximum Front Load | 0.00% |
| Maximum Deferred Load | 1.00% |
| Maximum Redemption Fee | -- |
| General Availability | |
| Available for Insurance Product | No |
| Available for RRSP | No |
| Purchase Details | |
| Open to New Investors |
|
| Minimum Initial Investment | 1000.00 None |
| Minimum Subsequent Investment | 100.00 None |
Basic Info
| Investment Strategy | |
| The Fund seeks income and capital appreciation. The Fund invests at least 65% of its total assets in income-producing equity and equity-related securities. The Fund seeks companies with the ability to sustain and/or grow their dividends. The Fund may also participate in the initial public offering market. |
| General | |
| Security Type | Mutual Fund |
| Equity Style | Large Cap Value |
| Broad Asset Class | International Equity |
| Broad Category | Equity |
| Global Peer Group | Equity Global Income |
| Peer Group | Global Equity Income Funds |
| Global Macro | Equity Global |
| US Macro | Developed Global Markets Funds |
| YCharts Categorization | -- |
| YCharts Benchmark | -- |
| Prospectus Objective | Global Funds |
| Fund Owner Firm Name | PGIM |
| Broad Asset Class Benchmark Index | |
| ^MSACXUSNTR | 100.0% |
Fundamentals
| General | |
| Distribution Yield | -- |
| Dividend Yield TTM (6-8-26) | 1.43% |
| 30-Day SEC Yield (4-30-26) | 0.92% |
| 7-Day SEC Yield | -- |
| Number of Holdings | 54 |
| Stock | |
| Weighted Average PE Ratio | 32.32 |
| Weighted Average Price to Sales Ratio | 6.555 |
| Weighted Average Price to Book Ratio | 7.921 |
| Weighted Median ROE | 284.8% |
| Weighted Median ROA | 7.89% |
| ROI (TTM) | 13.78% |
| Return on Investment (TTM) | 13.78% |
| Earning Yield | 0.0420 |
| LT Debt / Shareholders Equity | 0.9505 |
| Number of Equity Holdings | 48 |
As of April 30, 2026
Growth Metrics
| EPS Growth (1Y) | 15.33% |
| EPS Growth (3Y) | 6.96% |
| EPS Growth (5Y) | 15.36% |
| Sales Growth (1Y) | 6.98% |
| Sales Growth (3Y) | 3.31% |
| Sales Growth (5Y) | 7.20% |
| Sales per Share Growth (1Y) | 7.39% |
| Sales per Share Growth (3Y) | 2.33% |
| Operating Cash Flow - Growth Rate (3Y) | 9.00% |
As of April 30, 2026
Fund Details
Top Portfolio Holders
| Name | % Weight |
|---|---|
| Portfolio A | 5.00% |
| Portfolio B | 3.50% |
| Portfolio C | 2.25% |
Excel Add-In Codes
| Name: =YCI("M:AGOCX", "name") |
| Broad Asset Class: =YCI("M:AGOCX", "broad_asset_class") |
| Broad Category: =YCI("M:AGOCX", "broad_category_group") |
| Prospectus Objective: =YCI("M:AGOCX", "prospectus_objective") |
| To find the codes for any of our securities and financial metrics, see our Complete Excel Reference. |