

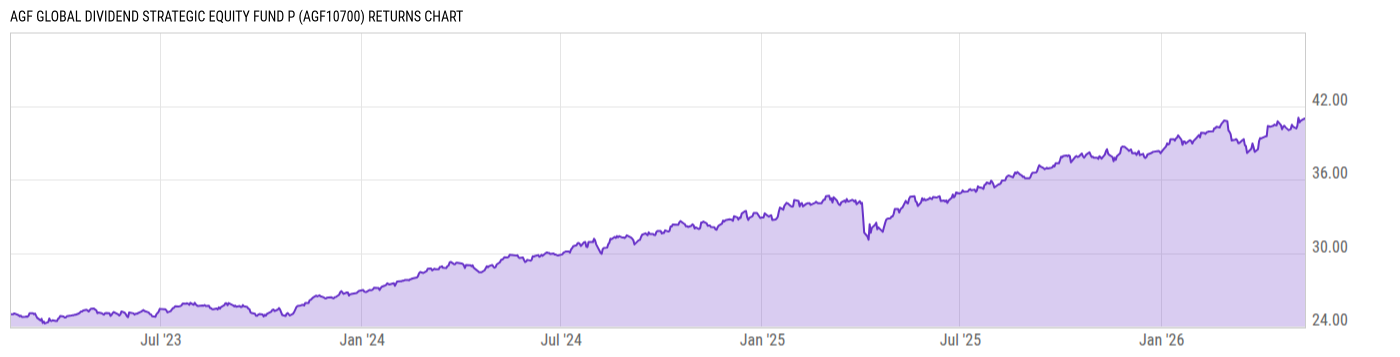
AGF Global Dividend Strategic Equity Fund P (AGF10700)
39.11
+0.03
(+0.08%)
CAD |
May 12 2026
Returns Chart
Key Stats
| Net Expense Ratio | Total Assets Under Management | Weighted Average Dividend Yield | Turnover Ratio (Generic) |
|---|---|---|---|
| 0.35% | 160.90M | -- | -- |
| 1 Year Fund Level Flows | 1 Year Total Returns (Daily) | Annualized Total Returns Since Inception (Daily) | Max Drawdown (Since Inception) |
| 51.67M | 19.63% |
Basic Info
| Investment Strategy | |
| The Fund's investment objective is to provide capital growth by investing primarily in units of underlying mutual funds and ETFs that provide exposure to a diversified portfolio of dividend-paying companies located around the world |
| General | |
| Security Type | Mutual Fund |
| Equity Style | -- |
| Broad Asset Class | International Equity |
| Broad Category | Equity |
| Global Peer Group | Equity Global Income |
| Peer Group | Global Dividend & Income Equity |
| Global Macro | Equity Global |
| US Macro | -- |
| YCharts Categorization | -- |
| YCharts Benchmark | -- |
| Prospectus Objective | -- |
| Fund Owner Firm Name | AGF |
| Broad Asset Class Benchmark Index | |
| ^SPTSX60TR | 100.0% |
Net Fund Flows Versus Peer Group
1 Month
% Rank:
10
-167.41M
Peer Group Low
72.80M
Peer Group High
1 Year
% Rank:
17
51.67M
-154.65M
Peer Group Low
1.249B
Peer Group High
3 Months
% Rank:
10
-158.13M
Peer Group Low
237.50M
Peer Group High
3 Years
% Rank:
12
-515.46M
Peer Group Low
1.337B
Peer Group High
6 Months
% Rank:
22
-128.91M
Peer Group Low
655.72M
Peer Group High
5 Years
% Rank:
17
-1.081B
Peer Group Low
1.340B
Peer Group High
YTD
% Rank:
7
-154.39M
Peer Group Low
312.71M
Peer Group High
10 Years
% Rank:
19
-1.283B
Peer Group Low
1.822B
Peer Group High
Date Unavailable
Risk
Performance Versus Peer Group
Annual Total Returns Versus Peers
As of May 13, 2026.
Asset Allocation
As of February 28, 2026.
| Type | % Net |
|---|---|
| Cash | 6.66% |
| Stock | 93.36% |
| Bond | 0.00% |
| Convertible | 0.00% |
| Preferred | 0.00% |
| Other | -0.03% |
Top 3 Holdings
| Name | % Weight | Price | % Change |
|---|---|---|---|
|
AGF Global Dividend Series O
|
88.00% | -- | -- |
|
AGF Enhanced U.S. Equity Income Fund F
|
7.84% | -- | -- |
|
Cash and Cash Equivalents
|
4.16% | -- | -- |
Fees & Availability
| Fees | |
| Actual 12B-1 Fee | -- |
| Actual Management Fee | -- |
| Administration Fee | -- |
| Maximum Front Load | -- |
| Maximum Deferred Load | -- |
| Maximum Redemption Fee | -- |
| General Availability | |
| Available for Insurance Product | No |
| Available for RRSP |
|
| Purchase Details | |
| Open to New Investors |
|
| Minimum Initial Investment | 500.00 None |
| Minimum Subsequent Investment | 25.00 None |
Basic Info
| Investment Strategy | |
| The Fund's investment objective is to provide capital growth by investing primarily in units of underlying mutual funds and ETFs that provide exposure to a diversified portfolio of dividend-paying companies located around the world |
| General | |
| Security Type | Mutual Fund |
| Equity Style | -- |
| Broad Asset Class | International Equity |
| Broad Category | Equity |
| Global Peer Group | Equity Global Income |
| Peer Group | Global Dividend & Income Equity |
| Global Macro | Equity Global |
| US Macro | -- |
| YCharts Categorization | -- |
| YCharts Benchmark | -- |
| Prospectus Objective | -- |
| Fund Owner Firm Name | AGF |
| Broad Asset Class Benchmark Index | |
| ^SPTSX60TR | 100.0% |
Fundamentals
| General | |
| Distribution Yield | -- |
| Dividend Yield TTM (5-12-26) | 1.17% |
| 30-Day SEC Yield | -- |
| 7-Day SEC Yield | -- |
| Number of Holdings | 3 |
| Stock | |
| Weighted Average PE Ratio | 28.97 |
| Weighted Average Price to Sales Ratio | 6.409 |
| Weighted Average Price to Book Ratio | 7.671 |
| Weighted Median ROE | 29.19% |
| Weighted Median ROA | 8.50% |
| ROI (TTM) | 13.37% |
| Return on Investment (TTM) | 13.37% |
| Earning Yield | 0.0421 |
| LT Debt / Shareholders Equity | 1.634 |
| Number of Equity Holdings | 0 |
As of February 28, 2026
Growth Metrics
| EPS Growth (1Y) | 18.08% |
| EPS Growth (3Y) | 3.54% |
| EPS Growth (5Y) | 9.43% |
| Sales Growth (1Y) | 6.88% |
| Sales Growth (3Y) | 4.27% |
| Sales Growth (5Y) | 6.38% |
| Sales per Share Growth (1Y) | 8.01% |
| Sales per Share Growth (3Y) | 5.64% |
| Operating Cash Flow - Growth Rate (3Y) | 7.00% |
As of February 28, 2026
Fund Details
| Key Dates | |
| Launch Date | 2/14/2023 |
| Last Annual Report Date | 9/30/2025 |
| Last Prospectus Date | -- |
| Attributes | |
| Index Fund | -- |
| Inverse Fund | No |
| Leveraged Fund | -- |
| Fund of Funds | No |
| Currency Hedged Fund | -- |
| Socially Responsible Fund | No |
Top Portfolio Holders
| Name | % Weight |
|---|---|
| Portfolio A | 5.00% |
| Portfolio B | 3.50% |
| Portfolio C | 2.25% |
Excel Add-In Codes
| Name: =YCI("M:AGF10700", "name") |
| Broad Asset Class: =YCI("M:AGF10700", "broad_asset_class") |
| Broad Category: =YCI("M:AGF10700", "broad_category_group") |
| Prospectus Objective: =YCI("M:AGF10700", "prospectus_objective") |
| To find the codes for any of our securities and financial metrics, see our Complete Excel Reference. |