

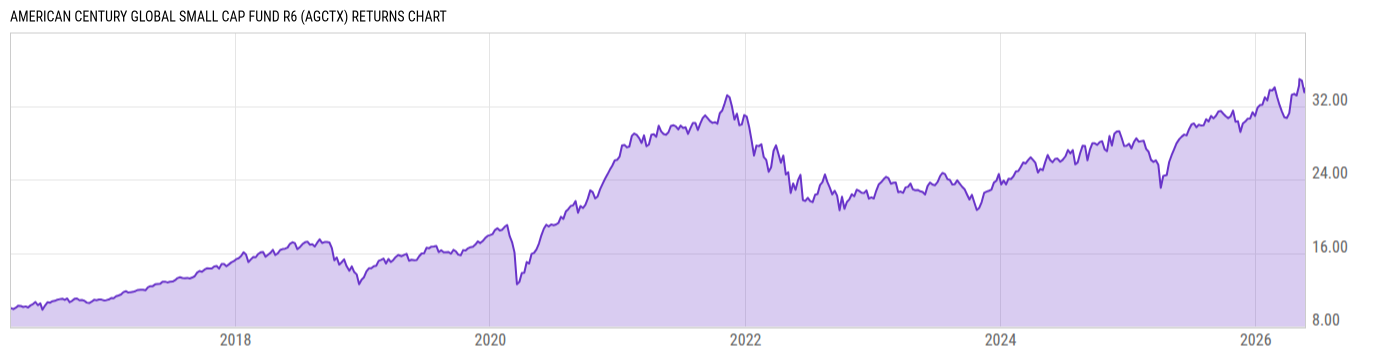
American Century Global Small Cap Fund R6 (AGCTX)
23.19
+0.15
(+0.65%)
USD |
May 22 2026
Returns Chart
Key Stats
| Net Expense Ratio | Total Assets Under Management | Weighted Average Dividend Yield | Turnover Ratio (Generic) |
|---|---|---|---|
| 0.76% | 64.47M | 1.38% | 140.0% |
| 1 Year Fund Level Flows | 1 Year Total Returns (Daily) | Annualized Total Returns Since Inception (Daily) | Max Drawdown (Since Inception) |
| -38.65M | 22.36% |
Basic Info
| Investment Strategy | |
| The Fund seeks capital growth. It will invest at least 80% of its net assets in securities issued by small cap companies. The managers consider small cap companies to include companies with market capitalizations not greater than that of the largest company on the MSCI ACWI Small Cap Index at the time of investment. |
| General | |
| Security Type | Mutual Fund |
| Equity Style | Small Cap Growth |
| Broad Asset Class | International Equity |
| Broad Category | Equity |
| Global Peer Group | Equity Global Sm&Mid Cap |
| Peer Group | Global Small-/Mid-Cap Funds |
| Global Macro | Equity Global |
| US Macro | Developed Global Markets Funds |
| YCharts Categorization | -- |
| YCharts Benchmark | -- |
| Prospectus Objective | Global Small-Cap Funds |
| Fund Owner Firm Name | American Century Investments |
| Broad Asset Class Benchmark Index | |
| ^MSACXUSNTR | 100.0% |
Net Fund Flows Versus Peer Group
1 Month
% Rank:
46
-1.063B
Peer Group Low
16.92M
Peer Group High
1 Year
% Rank:
59
-38.65M
-2.926B
Peer Group Low
420.65M
Peer Group High
3 Months
% Rank:
65
-1.071B
Peer Group Low
57.53M
Peer Group High
3 Years
% Rank:
49
-2.898B
Peer Group Low
462.91M
Peer Group High
6 Months
% Rank:
63
-2.601B
Peer Group Low
192.89M
Peer Group High
5 Years
% Rank:
44
-12.29B
Peer Group Low
3.306B
Peer Group High
YTD
% Rank:
64
-1.798B
Peer Group Low
102.34M
Peer Group High
10 Years
% Rank:
33
-13.28B
Peer Group Low
14.28B
Peer Group High
Date Unavailable
Risk
Performance Versus Peer Group
Annual Total Returns Versus Peers
As of May 24, 2026.
Asset Allocation
As of March 31, 2026.
| Type | % Net |
|---|---|
| Cash | 1.15% |
| Stock | 98.19% |
| Bond | 0.00% |
| Convertible | 0.00% |
| Preferred | 0.00% |
| Other | 0.65% |
Top 10 Holdings
| Name | % Weight | Price | % Change |
|---|---|---|---|
| Aritzia, Inc. | 1.83% | 140.67 | -1.17% |
| The 77 Bank, Ltd. | 1.56% | -- | -- |
| ATI, Inc. | 1.52% | 162.29 | 1.17% |
| Carpenter Technology Corp. | 1.42% | 434.12 | -0.96% |
| Five Below, Inc. | 1.40% | 219.50 | -0.13% |
| Subsea 7 SA | 1.39% | 35.36 | 0.00% |
| Finning International, Inc. | 1.38% | 72.96 | 5.54% |
| StoneX Group, Inc. | 1.36% | 112.12 | -0.27% |
| Sojitz Corp. | 1.34% | 40.00 | 0.00% |
| Argan, Inc. | 1.33% | 656.35 | 1.82% |
Fees & Availability
| Fees | |
| Actual 12B-1 Fee | -- |
| Actual Management Fee | 0.75% |
| Administration Fee | -- |
| Maximum Front Load | -- |
| Maximum Deferred Load | -- |
| Maximum Redemption Fee | -- |
| General Availability | |
| Available for Insurance Product | No |
| Available for RRSP | No |
| Purchase Details | |
| Open to New Investors |
|
| Minimum Initial Investment | 0.00 None |
| Minimum Subsequent Investment | 0.00 None |
Basic Info
| Investment Strategy | |
| The Fund seeks capital growth. It will invest at least 80% of its net assets in securities issued by small cap companies. The managers consider small cap companies to include companies with market capitalizations not greater than that of the largest company on the MSCI ACWI Small Cap Index at the time of investment. |
| General | |
| Security Type | Mutual Fund |
| Equity Style | Small Cap Growth |
| Broad Asset Class | International Equity |
| Broad Category | Equity |
| Global Peer Group | Equity Global Sm&Mid Cap |
| Peer Group | Global Small-/Mid-Cap Funds |
| Global Macro | Equity Global |
| US Macro | Developed Global Markets Funds |
| YCharts Categorization | -- |
| YCharts Benchmark | -- |
| Prospectus Objective | Global Small-Cap Funds |
| Fund Owner Firm Name | American Century Investments |
| Broad Asset Class Benchmark Index | |
| ^MSACXUSNTR | 100.0% |
Fundamentals
| General | |
| Distribution Yield | -- |
| Dividend Yield TTM (5-21-26) | 0.94% |
| 30-Day SEC Yield (7-31-23) | 0.00% |
| 7-Day SEC Yield | -- |
| Number of Holdings | 153 |
| Stock | |
| Weighted Average PE Ratio | 30.53 |
| Weighted Average Price to Sales Ratio | 4.647 |
| Weighted Average Price to Book Ratio | 5.117 |
| Weighted Median ROE | 15.21% |
| Weighted Median ROA | 5.36% |
| ROI (TTM) | 9.12% |
| Return on Investment (TTM) | 9.12% |
| Earning Yield | 0.0490 |
| LT Debt / Shareholders Equity | 0.7196 |
| Number of Equity Holdings | 139 |
As of March 31, 2026
Growth Metrics
| EPS Growth (1Y) | 28.59% |
| EPS Growth (3Y) | 17.06% |
| EPS Growth (5Y) | 18.73% |
| Sales Growth (1Y) | 15.01% |
| Sales Growth (3Y) | 12.65% |
| Sales Growth (5Y) | 15.91% |
| Sales per Share Growth (1Y) | 14.63% |
| Sales per Share Growth (3Y) | 10.82% |
| Operating Cash Flow - Growth Rate (3Y) | 44.49% |
As of March 31, 2026
Fund Details
Top Portfolio Holders
| Name | % Weight |
|---|---|
| Portfolio A | 5.00% |
| Portfolio B | 3.50% |
| Portfolio C | 2.25% |
Excel Add-In Codes
| Name: =YCI("M:AGCTX", "name") |
| Broad Asset Class: =YCI("M:AGCTX", "broad_asset_class") |
| Broad Category: =YCI("M:AGCTX", "broad_category_group") |
| Prospectus Objective: =YCI("M:AGCTX", "prospectus_objective") |
| To find the codes for any of our securities and financial metrics, see our Complete Excel Reference. |