

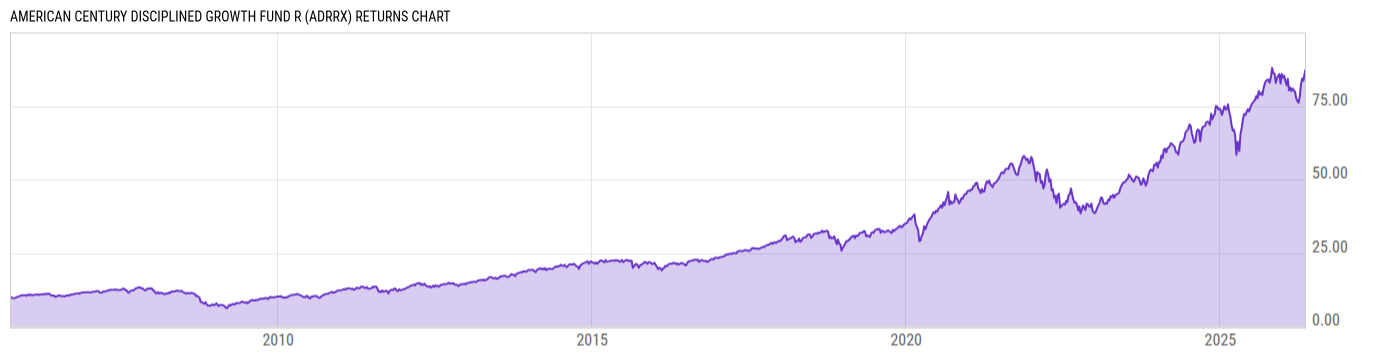
American Century Disciplined Growth Fund R (ADRRX)
20.34
-0.18
(-0.88%)
USD |
Jun 09 2026
Returns Chart
Key Stats
| Net Expense Ratio | Total Assets Under Management | Weighted Average Dividend Yield | Turnover Ratio (Generic) |
|---|---|---|---|
| 1.41% | 455.72M | 0.54% | 57.00% |
| 1 Year Fund Level Flows | 1 Year Total Returns (Daily) | Annualized Total Returns Since Inception (Daily) | Max Drawdown (Since Inception) |
| -59.03M | 17.57% |
Basic Info
| Investment Strategy | |
| The Fund seeks long-term capital growth. The Fund achieves this objective by investing primarily in the 1,500 largest publicly traded companies in the United States. The goal is to create a fund that provides better returns than its benchmark, the Russell 1000 Growth Index. |
| General | |
| Security Type | Mutual Fund |
| Equity Style | Large Cap Growth |
| Broad Asset Class | US Equity |
| Broad Category | Equity |
| Global Peer Group | Equity US |
| Peer Group | Large-Cap Growth Funds |
| Global Macro | Equity North America |
| US Macro | Large-Cap Funds |
| YCharts Categorization | -- |
| YCharts Benchmark | -- |
| Prospectus Objective | Growth Funds |
| Fund Owner Firm Name | American Century Investments |
| Broad Asset Class Benchmark Index | |
| ^SPXTR | 100.0% |
Net Fund Flows Versus Peer Group
1 Month
% Rank:
43
-3.548B
Peer Group Low
7.082B
Peer Group High
1 Year
% Rank:
41
-59.03M
-22.11B
Peer Group Low
23.25B
Peer Group High
3 Months
% Rank:
45
-6.537B
Peer Group Low
12.78B
Peer Group High
3 Years
% Rank:
43
-58.57B
Peer Group Low
59.92B
Peer Group High
6 Months
% Rank:
45
-12.51B
Peer Group Low
11.90B
Peer Group High
5 Years
% Rank:
45
-81.53B
Peer Group Low
81.23B
Peer Group High
YTD
% Rank:
46
-8.561B
Peer Group Low
11.19B
Peer Group High
10 Years
% Rank:
55
-131.73B
Peer Group Low
108.25B
Peer Group High
Date Unavailable
Risk
Performance Versus Peer Group
Annual Total Returns Versus Peers
As of June 10, 2026.
Asset Allocation
As of March 31, 2026.
| Type | % Net |
|---|---|
| Cash | 0.38% |
| Stock | 99.60% |
| Bond | 0.00% |
| Convertible | 0.00% |
| Preferred | 0.00% |
| Other | 0.03% |
Top 10 Holdings
| Name | % Weight | Price | % Change |
|---|---|---|---|
| NVIDIA Corp. | 12.33% | 200.44 | -3.72% |
| Apple, Inc. | 12.01% | 291.63 | 0.37% |
| Microsoft Corp. | 6.61% | 397.35 | -1.50% |
| Broadcom Inc. | 4.67% | 371.92 | -5.16% |
| Amazon.com, Inc. | 3.90% | 237.99 | -2.54% |
| Meta Platforms, Inc. | 3.27% | 570.96 | -2.33% |
| Alphabet, Inc. | 3.06% | 353.43 | -2.45% |
| Alphabet, Inc. | 2.63% | 356.50 | -2.13% |
| Tesla, Inc. | 2.52% | 381.59 | -3.80% |
| AbbVie, Inc. | 2.46% | 224.91 | -0.23% |
Fees & Availability
| Fees | |
| Actual 12B-1 Fee | 0.50% |
| Actual Management Fee | 0.91% |
| Administration Fee | -- |
| Maximum Front Load | -- |
| Maximum Deferred Load | -- |
| Maximum Redemption Fee | -- |
| General Availability | |
| Available for Insurance Product | No |
| Available for RRSP | No |
| Purchase Details | |
| Open to New Investors |
|
| Minimum Initial Investment | 2500.00 None |
| Minimum Subsequent Investment | 50.00 None |
Basic Info
| Investment Strategy | |
| The Fund seeks long-term capital growth. The Fund achieves this objective by investing primarily in the 1,500 largest publicly traded companies in the United States. The goal is to create a fund that provides better returns than its benchmark, the Russell 1000 Growth Index. |
| General | |
| Security Type | Mutual Fund |
| Equity Style | Large Cap Growth |
| Broad Asset Class | US Equity |
| Broad Category | Equity |
| Global Peer Group | Equity US |
| Peer Group | Large-Cap Growth Funds |
| Global Macro | Equity North America |
| US Macro | Large-Cap Funds |
| YCharts Categorization | -- |
| YCharts Benchmark | -- |
| Prospectus Objective | Growth Funds |
| Fund Owner Firm Name | American Century Investments |
| Broad Asset Class Benchmark Index | |
| ^SPXTR | 100.0% |
Fundamentals
| General | |
| Distribution Yield | -- |
| Dividend Yield TTM (6-8-26) | 0.25% |
| 30-Day SEC Yield (7-31-23) | 0.00% |
| 7-Day SEC Yield | -- |
| Number of Holdings | 145 |
| Stock | |
| Weighted Average PE Ratio | 35.95 |
| Weighted Average Price to Sales Ratio | 10.18 |
| Weighted Average Price to Book Ratio | 16.22 |
| Weighted Median ROE | 291.4% |
| Weighted Median ROA | 25.16% |
| ROI (TTM) | 34.59% |
| Return on Investment (TTM) | 34.59% |
| Earning Yield | 0.0318 |
| LT Debt / Shareholders Equity | 0.8282 |
| Number of Equity Holdings | 142 |
As of March 31, 2026
Growth Metrics
| EPS Growth (1Y) | 31.14% |
| EPS Growth (3Y) | 29.63% |
| EPS Growth (5Y) | 33.86% |
| Sales Growth (1Y) | 21.73% |
| Sales Growth (3Y) | 23.12% |
| Sales Growth (5Y) | 22.67% |
| Sales per Share Growth (1Y) | 31.63% |
| Sales per Share Growth (3Y) | 23.94% |
| Operating Cash Flow - Growth Rate (3Y) | 41.47% |
As of March 31, 2026
Fund Details
| Key Dates | |
| Inception Date | 9/30/2005 |
| Last Annual Report Date | 6/30/2025 |
| Last Prospectus Date | 11/1/2025 |
| Share Classes | |
| ADCCX | C |
| ADCIX | Inst |
| ADCVX | A |
| ADCYX | Inst |
| ADGGX | Retirement |
| ADSIX | Inv |
| Attributes | |
| Index Fund | -- |
| Inverse Fund | No |
| Leveraged Fund | -- |
| Fund of Funds | No |
| Currency Hedged Fund | -- |
| Socially Responsible Fund | No |
Top Portfolio Holders
| Name | % Weight |
|---|---|
| Portfolio A | 5.00% |
| Portfolio B | 3.50% |
| Portfolio C | 2.25% |
Excel Add-In Codes
| Name: =YCI("M:ADRRX", "name") |
| Broad Asset Class: =YCI("M:ADRRX", "broad_asset_class") |
| Broad Category: =YCI("M:ADRRX", "broad_category_group") |
| Prospectus Objective: =YCI("M:ADRRX", "prospectus_objective") |
| To find the codes for any of our securities and financial metrics, see our Complete Excel Reference. |