

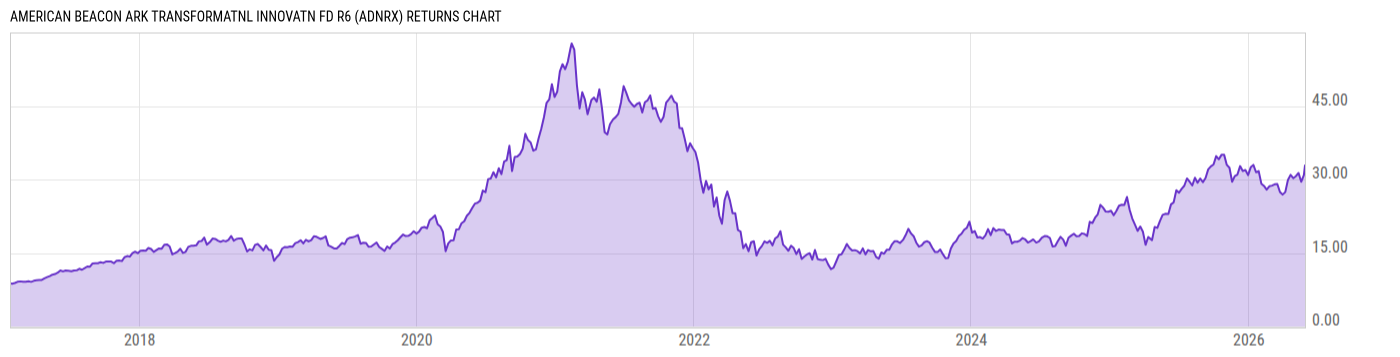
American Beacon ARK Transformatnl Innovatn Fd R6 (ADNRX)
22.84
+0.27
(+1.20%)
USD |
May 29 2026
Returns Chart
Key Stats
| Net Expense Ratio | Total Assets Under Management | Weighted Average Dividend Yield | Turnover Ratio (Generic) |
|---|---|---|---|
| 1.05% | 176.62M | 0.05% | 46.00% |
| 1 Year Fund Level Flows | 1 Year Total Returns (Daily) | Annualized Total Returns Since Inception (Daily) | Max Drawdown (Since Inception) |
| -64.84M | 46.50% |
Basic Info
| Investment Strategy | |
| The Fund seeks long-term growth of capital. The Fund seeks to achieve its objective by investing primarily all of the Fund's assets in domestic and foreign equity securities including common stocks and other equity investments or ownership interests in business enterprises that are relevant to disruptive innovation. |
| General | |
| Security Type | Mutual Fund |
| Equity Style | Multi Cap Growth |
| Broad Asset Class | Sector Equity |
| Broad Category | Equity |
| Global Peer Group | Equity Sector Information Technology |
| Peer Group | Global Science/Technology Funds |
| Global Macro | Equity Industry Sector |
| US Macro | World Sector Equity Funds |
| YCharts Categorization | -- |
| YCharts Benchmark | -- |
| Prospectus Objective | Global Science/Technology Funds |
| Fund Owner Firm Name | American Beacon |
| Broad Asset Class Benchmark Index | |
| ^MSWNTR | 100.0% |
Net Fund Flows Versus Peer Group
1 Month
% Rank:
85
-151.07M
Peer Group Low
2.117B
Peer Group High
1 Year
% Rank:
75
-64.84M
-1.019B
Peer Group Low
9.846B
Peer Group High
3 Months
% Rank:
84
-328.72M
Peer Group Low
2.401B
Peer Group High
3 Years
% Rank:
76
-1.707B
Peer Group Low
10.04B
Peer Group High
6 Months
% Rank:
74
-744.53M
Peer Group Low
3.484B
Peer Group High
5 Years
% Rank:
82
-3.665B
Peer Group Low
10.04B
Peer Group High
YTD
% Rank:
81
-491.87M
Peer Group Low
2.476B
Peer Group High
10 Years
% Rank:
29
-3.052B
Peer Group Low
11.78B
Peer Group High
Date Unavailable
Risk
Performance Versus Peer Group
Annual Total Returns Versus Peers
As of May 31, 2026.
Asset Allocation
As of March 31, 2026.
| Type | % Net |
|---|---|
| Cash | 0.35% |
| Stock | 99.06% |
| Bond | 0.58% |
| Convertible | 0.00% |
| Preferred | 0.00% |
| Other | 0.02% |
Top 10 Holdings
| Name | % Weight | Price | % Change |
|---|---|---|---|
| Tesla, Inc. | 10.39% | 435.79 | -1.43% |
| CRISPR Therapeutics AG | 6.19% | 56.18 | -0.35% |
| Tempus AI, Inc. | 5.13% | 50.47 | -1.60% |
| Shopify, Inc. | 4.80% | 118.71 | 3.20% |
| Circle Internet Group, Inc. | 4.53% | 113.00 | 4.40% |
| Coinbase Global, Inc. | 4.44% | 189.03 | 3.72% |
| Robinhood Markets, Inc. | 4.27% | 94.30 | 11.15% |
| Advanced Micro Devices, Inc. | 4.11% | 516.10 | -0.38% |
| Roku, Inc. | 4.04% | 130.18 | -0.69% |
| Roblox Corp. | 3.58% | 47.15 | 0.68% |
Fees & Availability
| Fees | |
| Actual 12B-1 Fee | -- |
| Actual Management Fee | 0.77% |
| Administration Fee | -- |
| Maximum Front Load | -- |
| Maximum Deferred Load | -- |
| Maximum Redemption Fee | -- |
| General Availability | |
| Available for Insurance Product | No |
| Available for RRSP | No |
| Purchase Details | |
| Open to New Investors |
|
| Minimum Initial Investment | 0.00 None |
| Minimum Subsequent Investment | 50.00 None |
Basic Info
| Investment Strategy | |
| The Fund seeks long-term growth of capital. The Fund seeks to achieve its objective by investing primarily all of the Fund's assets in domestic and foreign equity securities including common stocks and other equity investments or ownership interests in business enterprises that are relevant to disruptive innovation. |
| General | |
| Security Type | Mutual Fund |
| Equity Style | Multi Cap Growth |
| Broad Asset Class | Sector Equity |
| Broad Category | Equity |
| Global Peer Group | Equity Sector Information Technology |
| Peer Group | Global Science/Technology Funds |
| Global Macro | Equity Industry Sector |
| US Macro | World Sector Equity Funds |
| YCharts Categorization | -- |
| YCharts Benchmark | -- |
| Prospectus Objective | Global Science/Technology Funds |
| Fund Owner Firm Name | American Beacon |
| Broad Asset Class Benchmark Index | |
| ^MSWNTR | 100.0% |
Fundamentals
| General | |
| Distribution Yield | -- |
| Dividend Yield TTM (5-28-26) | 3.96% |
| 30-Day SEC Yield | -- |
| 7-Day SEC Yield | -- |
| Number of Holdings | 43 |
| Stock | |
| Weighted Average PE Ratio | 50.12 |
| Weighted Average Price to Sales Ratio | 17.07 |
| Weighted Average Price to Book Ratio | 9.333 |
| Weighted Median ROE | -17.75% |
| Weighted Median ROA | -0.62% |
| ROI (TTM) | 0.26% |
| Return on Investment (TTM) | 0.26% |
| Earning Yield | 0.0220 |
| LT Debt / Shareholders Equity | 1.879 |
| Number of Equity Holdings | 41 |
As of March 31, 2026
Growth Metrics
| EPS Growth (1Y) | 17.92% |
| EPS Growth (3Y) | 6.36% |
| EPS Growth (5Y) | 34.25% |
| Sales Growth (1Y) | 26.94% |
| Sales Growth (3Y) | 30.01% |
| Sales Growth (5Y) | 31.83% |
| Sales per Share Growth (1Y) | 20.27% |
| Sales per Share Growth (3Y) | 35.45% |
| Operating Cash Flow - Growth Rate (3Y) | 62.64% |
As of March 31, 2026
Fund Details
Top Portfolio Holders
| Name | % Weight |
|---|---|
| Portfolio A | 5.00% |
| Portfolio B | 3.50% |
| Portfolio C | 2.25% |
Excel Add-In Codes
| Name: =YCI("M:ADNRX", "name") |
| Broad Asset Class: =YCI("M:ADNRX", "broad_asset_class") |
| Broad Category: =YCI("M:ADNRX", "broad_category_group") |
| Prospectus Objective: =YCI("M:ADNRX", "prospectus_objective") |
| To find the codes for any of our securities and financial metrics, see our Complete Excel Reference. |