

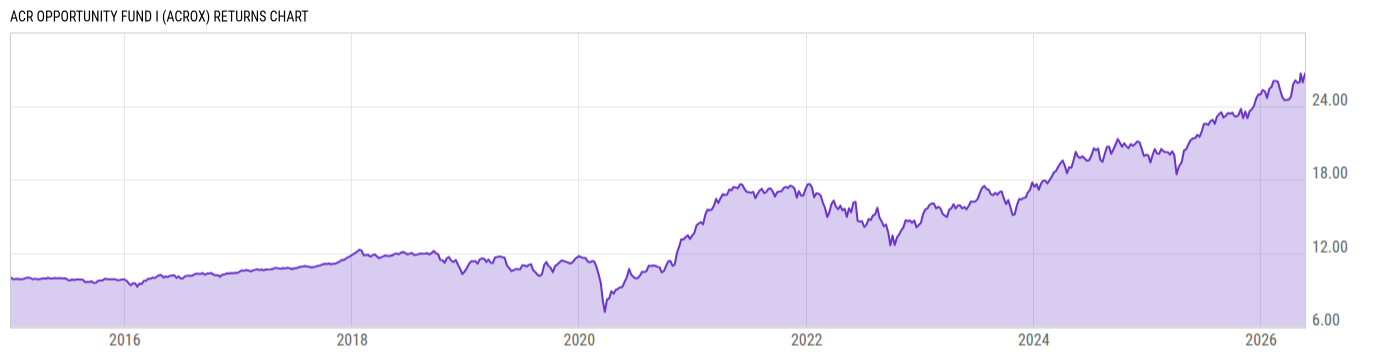
ACR Opportunity Fund I (ACROX)
20.59
0.00 (0.00%)
USD |
Jun 09 2026
Returns Chart
Key Stats
| Net Expense Ratio | Total Assets Under Management | Weighted Average Dividend Yield | Turnover Ratio (Generic) |
|---|---|---|---|
| 1.25% | 124.76M | -- | 24.00% |
| 1 Year Fund Level Flows | 1 Year Total Returns (Daily) | Annualized Total Returns Since Inception (Daily) | Max Drawdown (Since Inception) |
| 15.48M | 27.12% |
Basic Info
| Investment Strategy | |
| The Fund seeks to preserve capital from permanent loss during periods of economic decline, and to provide above average absolute and relative returns in the long run. The Fund pursues its investment objectives by investing its assets in equity securities, debt securities, derivative securities, cash and cash equivalents. |
| General | |
| Security Type | Mutual Fund |
| Equity Style | -- |
| Broad Asset Class | Alternative |
| Broad Category | Alternative Strategies |
| Global Peer Group | Absolute Return USD High |
| Peer Group | Absolute Return Funds |
| Global Macro | Absolute Return |
| US Macro | Alternative Equity Funds |
| YCharts Categorization | -- |
| YCharts Benchmark | -- |
| Prospectus Objective | Absolute Return Funds |
| Fund Owner Firm Name | ACR Alpine Capital Research |
| Broad Asset Class Benchmark Index | |
| ^MSACWINTR | 100.0% |
Net Fund Flows Versus Peer Group
1 Month
% Rank:
35
-68.03M
Peer Group Low
52.92M
Peer Group High
1 Year
% Rank:
36
15.48M
-169.48M
Peer Group Low
717.90M
Peer Group High
3 Months
% Rank:
55
-77.17M
Peer Group Low
300.39M
Peer Group High
3 Years
% Rank:
33
-1.988B
Peer Group Low
1.412B
Peer Group High
6 Months
% Rank:
50
-73.27M
Peer Group Low
418.42M
Peer Group High
5 Years
% Rank:
40
-2.626B
Peer Group Low
1.282B
Peer Group High
YTD
% Rank:
48
-57.70M
Peer Group Low
385.57M
Peer Group High
10 Years
% Rank:
49
-8.918B
Peer Group Low
3.228B
Peer Group High
Date Unavailable
Risk
Performance Versus Peer Group
Annual Total Returns Versus Peers
As of June 10, 2026.
Asset Allocation
As of February 28, 2026.
| Type | % Net |
|---|---|
| Cash | 6.20% |
| Stock | 79.25% |
| Bond | 14.29% |
| Convertible | 0.00% |
| Preferred | 0.24% |
| Other | 0.02% |
Top 10 Holdings
| Name | % Weight | Price | % Change |
|---|---|---|---|
|
UMB Bank NA
|
6.18% | -- | -- |
| Vodafone Group Plc | 5.58% | 14.81 | 0.95% |
| Barclays PLC | 5.13% | 24.00 | -1.32% |
| General Motors Co. | 4.71% | 82.93 | -0.99% |
| ISS A/S | 4.60% | 30.50 | 0.00% |
| iShares 0-3 Month Treasury Bond ETF | 4.55% | 100.48 | 0.01% |
| Vanguard Short-Term Treasury Index Fund ETF | 4.31% | 58.10 | 0.03% |
| FedEx Corp. | 3.76% | 326.00 | -1.74% |
| People, Inc. | 3.73% | 42.22 | 0.33% |
| Citigroup, Inc. | 3.35% | 134.67 | -0.04% |
Fees & Availability
| Fees | |
| Actual 12B-1 Fee | -- |
| Actual Management Fee | 0.82% |
| Administration Fee | 130.3K% |
| Maximum Front Load | -- |
| Maximum Deferred Load | -- |
| Maximum Redemption Fee | 2.00% |
| General Availability | |
| Available for Insurance Product | No |
| Available for RRSP | No |
| Purchase Details | |
| Open to New Investors |
|
| Minimum Initial Investment | 10000.00 None |
| Minimum Subsequent Investment | 100.00 None |
Basic Info
| Investment Strategy | |
| The Fund seeks to preserve capital from permanent loss during periods of economic decline, and to provide above average absolute and relative returns in the long run. The Fund pursues its investment objectives by investing its assets in equity securities, debt securities, derivative securities, cash and cash equivalents. |
| General | |
| Security Type | Mutual Fund |
| Equity Style | -- |
| Broad Asset Class | Alternative |
| Broad Category | Alternative Strategies |
| Global Peer Group | Absolute Return USD High |
| Peer Group | Absolute Return Funds |
| Global Macro | Absolute Return |
| US Macro | Alternative Equity Funds |
| YCharts Categorization | -- |
| YCharts Benchmark | -- |
| Prospectus Objective | Absolute Return Funds |
| Fund Owner Firm Name | ACR Alpine Capital Research |
| Broad Asset Class Benchmark Index | |
| ^MSACWINTR | 100.0% |
Fundamentals
| General | |
| Distribution Yield | -- |
| Dividend Yield TTM (6-8-26) | 1.12% |
| 30-Day SEC Yield | -- |
| 7-Day SEC Yield | -- |
| Number of Holdings | 43 |
| Stock | |
| Weighted Average PE Ratio | 21.53 |
| Weighted Average Price to Sales Ratio | 1.079 |
| Weighted Average Price to Book Ratio | 1.697 |
| Weighted Median ROE | 5.96% |
| Weighted Median ROA | 1.53% |
| ROI (TTM) | 4.61% |
| Return on Investment (TTM) | 4.61% |
| Earning Yield | 0.0589 |
| LT Debt / Shareholders Equity | 0.7708 |
| Number of Equity Holdings | 36 |
| Bond | |
| Yield to Maturity (2-28-26) | 3.62% |
| Effective Duration | -- |
| Average Coupon | 2.34% |
| Calculated Average Quality | 2.00 |
| Effective Maturity | 0.6927 |
| Nominal Maturity | 0.6927 |
| Number of Bond Holdings | 3 |
As of February 28, 2026
Growth Metrics
| EPS Growth (1Y) | -1.13% |
| EPS Growth (3Y) | 5.60% |
| EPS Growth (5Y) | 12.05% |
| Sales Growth (1Y) | 1.91% |
| Sales Growth (3Y) | 0.77% |
| Sales Growth (5Y) | 4.06% |
| Sales per Share Growth (1Y) | 5.51% |
| Sales per Share Growth (3Y) | 3.53% |
| Operating Cash Flow - Growth Rate (3Y) | 3.54% |
As of February 28, 2026
Fund Details
| Key Dates | |
| Inception Date | 12/31/2014 |
| Last Annual Report Date | 11/30/2025 |
| Last Prospectus Date | 3/31/2026 |
| Attributes | |
| Index Fund | -- |
| Inverse Fund | No |
| Leveraged Fund | -- |
| Fund of Funds | No |
| Currency Hedged Fund | -- |
| Socially Responsible Fund | No |
Top Portfolio Holders
| Name | % Weight |
|---|---|
| Portfolio A | 5.00% |
| Portfolio B | 3.50% |
| Portfolio C | 2.25% |
Excel Add-In Codes
| Name: =YCI("M:ACROX", "name") |
| Broad Asset Class: =YCI("M:ACROX", "broad_asset_class") |
| Broad Category: =YCI("M:ACROX", "broad_category_group") |
| Prospectus Objective: =YCI("M:ACROX", "prospectus_objective") |
| To find the codes for any of our securities and financial metrics, see our Complete Excel Reference. |