

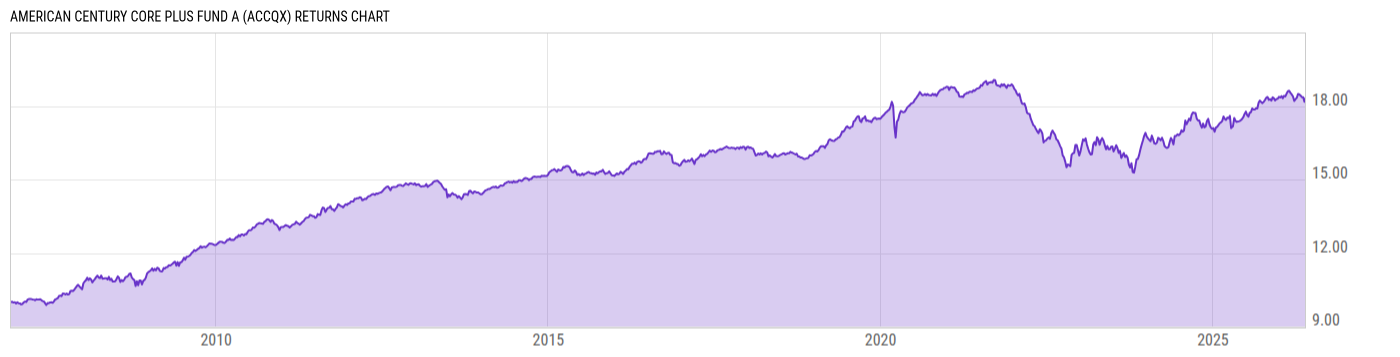
American Century Core Plus Fund A (ACCQX)
9.12
+0.01
(+0.11%)
USD |
May 22 2026
Returns Chart
Key Stats
| Net Expense Ratio | Total Assets Under Management | Weighted Average Dividend Yield | Turnover Ratio (Generic) |
|---|---|---|---|
| 0.80% | 382.47M | -- | 132.0% |
| 1 Year Fund Level Flows | 1 Year Total Returns (Daily) | Annualized Total Returns Since Inception (Daily) | Max Drawdown (Since Inception) |
| -55.59M | 5.89% |
Basic Info
| Investment Strategy | |
| The Fund seeks to maximize total return and as a secondary objective, the Fund seeks a high level of income. The Fund invests at least 65% of its assets in investment-grade debt with average maturity of 3.5 years or longer. |
| General | |
| Security Type | Mutual Fund |
| Equity Style | -- |
| Broad Asset Class | Taxable Bond |
| Broad Category | Fixed Income |
| Global Peer Group | Bond USD Medium Term |
| Peer Group | Core Plus Bond Funds |
| Global Macro | Bond HC |
| US Macro | Short/Intermediate Investment-Grade Funds |
| YCharts Categorization | -- |
| YCharts Benchmark | -- |
| Prospectus Objective | Core Bond Funds |
| Fund Owner Firm Name | American Century Investments |
| Broad Asset Class Benchmark Index | |
| ^BBUSATR | 100.0% |
Net Fund Flows Versus Peer Group
1 Month
% Rank:
63
-506.28M
Peer Group Low
548.29M
Peer Group High
1 Year
% Rank:
67
-55.59M
-5.866B
Peer Group Low
4.985B
Peer Group High
3 Months
% Rank:
76
-1.521B
Peer Group Low
1.762B
Peer Group High
3 Years
% Rank:
66
-38.18B
Peer Group Low
16.31B
Peer Group High
6 Months
% Rank:
76
-2.963B
Peer Group Low
3.321B
Peer Group High
5 Years
% Rank:
65
-52.99B
Peer Group Low
16.59B
Peer Group High
YTD
% Rank:
75
-1.872B
Peer Group Low
2.090B
Peer Group High
10 Years
% Rank:
52
-53.85B
Peer Group Low
35.16B
Peer Group High
Date Unavailable
Risk
Performance Versus Peer Group
Annual Total Returns Versus Peers
As of May 23, 2026.
Asset Allocation
As of March 31, 2026.
| Type | % Net |
|---|---|
| Cash | 1.06% |
| Stock | 0.00% |
| Bond | 98.28% |
| Convertible | 0.00% |
| Preferred | 0.00% |
| Other | 0.66% |
Top 10 Holdings
| Name | % Weight | Price | % Change |
|---|---|---|---|
|
2YR T-NOTE JUN26
|
14.78% | -- | -- |
|
ULTRA BOND JUN26
|
5.44% | -- | -- |
|
US T BONDS JUN26
|
4.13% | -- | -- |
|
10Y TNotes JUN26
|
1.52% | -- | -- |
|
Federal National Mortgage Association 5% 01-APR-2056
|
1.32% | -- | -- |
|
Government National Mortgage Association 2 20-APR-2054 MA9602
|
1.07% | -- | -- |
|
Federal National Mortgage Association 01-APR-2054 FA2719
|
0.99% | -- | -- |
|
Regatta Funding Company LLC 0% 01-APR-2026
|
0.85% | -- | -- |
|
Federal National Mortgage Association 01-MAR-2054 CB8146
|
0.82% | -- | -- |
| GNMA 4.0 09/20/2052 FIX USD Agency | 0.80% | 93.30 | 0.13% |
Fees & Availability
| Fees | |
| Actual 12B-1 Fee | 0.25% |
| Actual Management Fee | 0.54% |
| Administration Fee | -- |
| Maximum Front Load | 4.50% |
| Maximum Deferred Load | -- |
| Maximum Redemption Fee | -- |
| General Availability | |
| Available for Insurance Product | -- |
| Available for RRSP | -- |
| Purchase Details | |
| Open to New Investors |
|
| Minimum Initial Investment | 2500.00 None |
| Minimum Subsequent Investment | 50.00 None |
Basic Info
| Investment Strategy | |
| The Fund seeks to maximize total return and as a secondary objective, the Fund seeks a high level of income. The Fund invests at least 65% of its assets in investment-grade debt with average maturity of 3.5 years or longer. |
| General | |
| Security Type | Mutual Fund |
| Equity Style | -- |
| Broad Asset Class | Taxable Bond |
| Broad Category | Fixed Income |
| Global Peer Group | Bond USD Medium Term |
| Peer Group | Core Plus Bond Funds |
| Global Macro | Bond HC |
| US Macro | Short/Intermediate Investment-Grade Funds |
| YCharts Categorization | -- |
| YCharts Benchmark | -- |
| Prospectus Objective | Core Bond Funds |
| Fund Owner Firm Name | American Century Investments |
| Broad Asset Class Benchmark Index | |
| ^BBUSATR | 100.0% |
Fundamentals
| General | |
| Distribution Yield | -- |
| Dividend Yield TTM (5-21-26) | 4.49% |
| 30-Day SEC Yield (4-30-26) | 4.29% |
| 7-Day SEC Yield | -- |
| Number of Holdings | 610 |
| Bond | |
| Yield to Maturity (3-31-26) | 5.54% |
| Effective Duration | 6.09 |
| Average Coupon | 5.60% |
| Calculated Average Quality | 3.241 |
| Effective Maturity | 19.26 |
| Nominal Maturity | 21.58 |
| Number of Bond Holdings | 491 |
As of March 31, 2026
Fund Details
| Key Dates | |
| Inception Date | 11/30/2006 |
| Last Annual Report Date | 3/31/2025 |
| Last Prospectus Date | 8/1/2025 |
| Share Classes | |
| ACCKX | C |
| ACCNX | Inv |
| ACCPX | Retirement |
| ACCTX | Inst |
| ACCUX | Retirement |
| ACCYX | Other |
| Attributes | |
| Index Fund | -- |
| Inverse Fund | -- |
| Leveraged Fund | -- |
| Fund of Funds | No |
| Currency Hedged Fund | -- |
| Socially Responsible Fund | No |
Top Portfolio Holders
| Name | % Weight |
|---|---|
| Portfolio A | 5.00% |
| Portfolio B | 3.50% |
| Portfolio C | 2.25% |
Excel Add-In Codes
| Name: =YCI("M:ACCQX", "name") |
| Broad Asset Class: =YCI("M:ACCQX", "broad_asset_class") |
| Broad Category: =YCI("M:ACCQX", "broad_category_group") |
| Prospectus Objective: =YCI("M:ACCQX", "prospectus_objective") |
| To find the codes for any of our securities and financial metrics, see our Complete Excel Reference. |