

American Century International Growth Fund G (ACAEX)
14.24
+0.06
(+0.42%)
USD |
Jun 02 2026
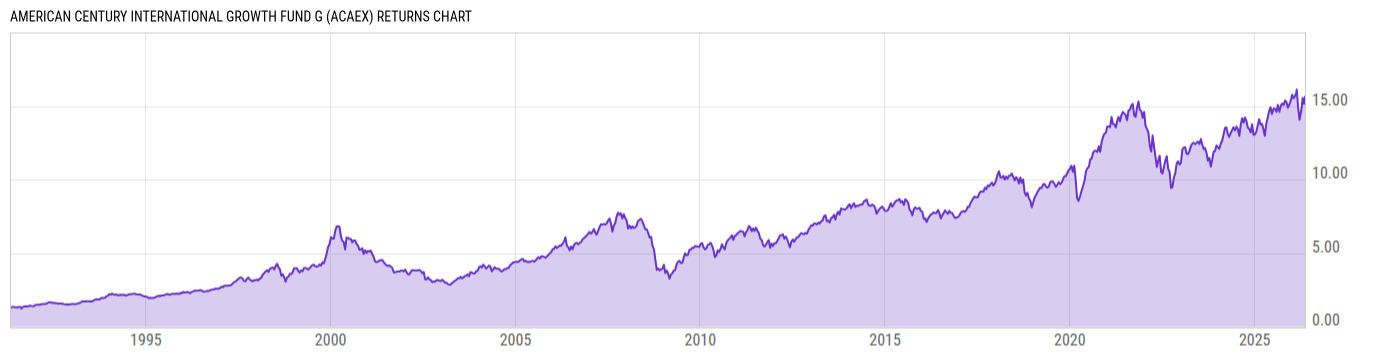
Returns Chart
Key Stats
| Net Expense Ratio | Total Assets Under Management | Weighted Average Dividend Yield | Turnover Ratio (Generic) |
|---|---|---|---|
| 0.02% | 2.254B | 1.99% | 65.00% |
| 1 Year Fund Level Flows | 1 Year Total Returns (Daily) | Annualized Total Returns Since Inception (Daily) | Max Drawdown (Since Inception) |
| -632.70M | 5.68% |
Basic Info
| Investment Strategy | |
| The Fund seeks capital growth. Investing primarily in securities of companies located in at least three developed countries world-wide excluding the United States. The portfolio managers make their investment decisions based primarily on their analysis of individual companies, rather than on broad economic forecasts. |
| General | |
| Security Type | Mutual Fund |
| Equity Style | Large Cap Growth |
| Broad Asset Class | International Equity |
| Broad Category | Equity |
| Global Peer Group | Equity Global ex US |
| Peer Group | International Large-Cap Growth |
| Global Macro | Equity Global |
| US Macro | Developed International Markets Funds |
| YCharts Categorization | -- |
| YCharts Benchmark | -- |
| Prospectus Objective | International Funds |
| Fund Owner Firm Name | American Century Investments |
| Broad Asset Class Benchmark Index | |
| ^MSACXUSNTR | 100.0% |
Net Fund Flows Versus Peer Group
1 Month
% Rank:
81
-820.02M
Peer Group Low
381.70M
Peer Group High
1 Year
% Rank:
83
-632.70M
-23.62B
Peer Group Low
2.310B
Peer Group High
3 Months
% Rank:
87
-3.163B
Peer Group Low
5.340B
Peer Group High
3 Years
% Rank:
81
-54.46B
Peer Group Low
3.519B
Peer Group High
6 Months
% Rank:
86
-10.70B
Peer Group Low
5.146B
Peer Group High
5 Years
% Rank:
80
-79.53B
Peer Group Low
6.055B
Peer Group High
YTD
% Rank:
88
-5.129B
Peer Group Low
5.340B
Peer Group High
10 Years
% Rank:
86
-105.94B
Peer Group Low
8.807B
Peer Group High
Date Unavailable
Risk
Performance Versus Peer Group
Annual Total Returns Versus Peers
As of June 03, 2026.
Asset Allocation
As of March 31, 2026.
| Type | % Net |
|---|---|
| Cash | 1.48% |
| Stock | 98.46% |
| Bond | 0.00% |
| Convertible | 0.00% |
| Preferred | 0.58% |
| Other | -0.53% |
Top 10 Holdings
| Name | % Weight | Price | % Change |
|---|---|---|---|
| ASML Holding NV | 3.68% | 1695.42 | 2.39% |
| AstraZeneca PLC | 3.22% | 176.32 | -0.64% |
| British American Tobacco plc | 1.94% | 60.66 | 0.00% |
| Iberdrola SA | 1.92% | 22.78 | 0.77% |
| Schneider Electric SE | 1.92% | 336.15 | 3.56% |
| Sumitomo Mitsui Financial Group, Inc. | 1.84% | 38.23 | 0.59% |
| Eni SpA | 1.74% | 26.05 | 0.00% |
| Siemens Energy AG | 1.71% | 183.56 | -2.01% |
| Terumo Corp. | 1.71% | 13.60 | 0.00% |
| AIB Group plc | 1.70% | 11.66 | 0.43% |
Fees & Availability
| Fees | |
| Actual 12B-1 Fee | -- |
| Actual Management Fee | 0.00% |
| Administration Fee | -- |
| Maximum Front Load | -- |
| Maximum Deferred Load | -- |
| Maximum Redemption Fee | -- |
| General Availability | |
| Available for Insurance Product | No |
| Available for RRSP | No |
| Purchase Details | |
| Open to New Investors |
|
| Minimum Initial Investment | 0.00 None |
| Minimum Subsequent Investment | 0.00 None |
Basic Info
| Investment Strategy | |
| The Fund seeks capital growth. Investing primarily in securities of companies located in at least three developed countries world-wide excluding the United States. The portfolio managers make their investment decisions based primarily on their analysis of individual companies, rather than on broad economic forecasts. |
| General | |
| Security Type | Mutual Fund |
| Equity Style | Large Cap Growth |
| Broad Asset Class | International Equity |
| Broad Category | Equity |
| Global Peer Group | Equity Global ex US |
| Peer Group | International Large-Cap Growth |
| Global Macro | Equity Global |
| US Macro | Developed International Markets Funds |
| YCharts Categorization | -- |
| YCharts Benchmark | -- |
| Prospectus Objective | International Funds |
| Fund Owner Firm Name | American Century Investments |
| Broad Asset Class Benchmark Index | |
| ^MSACXUSNTR | 100.0% |
Fundamentals
| General | |
| Distribution Yield | -- |
| Dividend Yield TTM (6-1-26) | 1.72% |
| 30-Day SEC Yield (4-30-26) | 0.00% |
| 7-Day SEC Yield | -- |
| Number of Holdings | 107 |
| Stock | |
| Weighted Average PE Ratio | 26.63 |
| Weighted Average Price to Sales Ratio | 4.314 |
| Weighted Average Price to Book Ratio | 5.081 |
| Weighted Median ROE | 23.87% |
| Weighted Median ROA | 6.99% |
| ROI (TTM) | 12.45% |
| Return on Investment (TTM) | 12.45% |
| Earning Yield | 0.0488 |
| LT Debt / Shareholders Equity | 0.5892 |
| Number of Equity Holdings | 97 |
As of March 31, 2026
Growth Metrics
| EPS Growth (1Y) | 22.05% |
| EPS Growth (3Y) | 13.68% |
| EPS Growth (5Y) | 19.52% |
| Sales Growth (1Y) | 7.05% |
| Sales Growth (3Y) | 6.84% |
| Sales Growth (5Y) | 10.01% |
| Sales per Share Growth (1Y) | 6.84% |
| Sales per Share Growth (3Y) | 6.65% |
| Operating Cash Flow - Growth Rate (3Y) | 15.27% |
As of March 31, 2026
Fund Details
| Key Dates | |
| Inception Date | 4/1/2022 |
| Last Annual Report Date | 11/30/2025 |
| Last Prospectus Date | 8/1/2025 |
| Share Classes | |
| AIWCX | C |
| ATGDX | Retirement |
| ATGGX | Retirement |
| ATGRX | Retirement |
| ATYGX | Inst |
| TGRIX | Inst |
| TWGAX | A |
| TWIEX | Inv |
| Attributes | |
| Index Fund | -- |
| Inverse Fund | No |
| Leveraged Fund | -- |
| Fund of Funds | No |
| Currency Hedged Fund | -- |
| Socially Responsible Fund | No |
Top Portfolio Holders
| Name | % Weight |
|---|---|
| Portfolio A | 5.00% |
| Portfolio B | 3.50% |
| Portfolio C | 2.25% |
Excel Add-In Codes
| Name: =YCI("M:ACAEX", "name") |
| Broad Asset Class: =YCI("M:ACAEX", "broad_asset_class") |
| Broad Category: =YCI("M:ACAEX", "broad_category_group") |
| Prospectus Objective: =YCI("M:ACAEX", "prospectus_objective") |
| To find the codes for any of our securities and financial metrics, see our Complete Excel Reference. |