

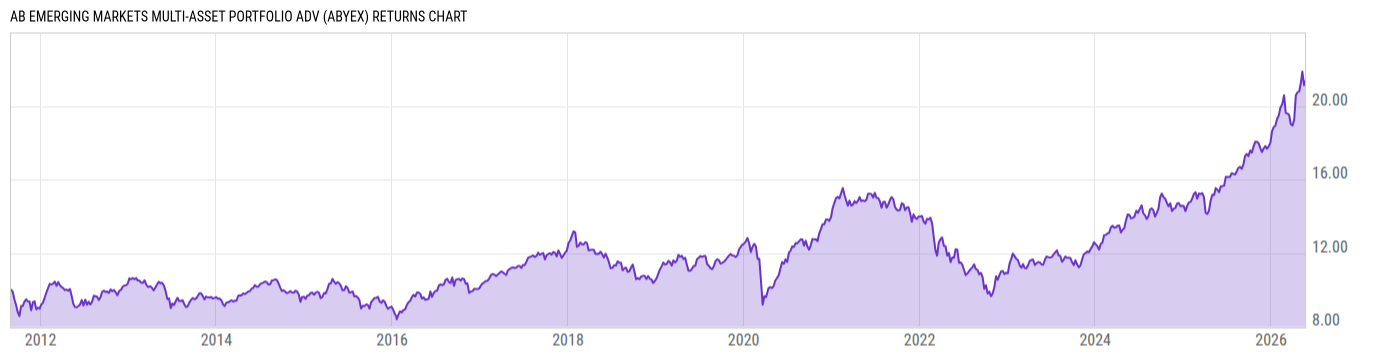
AB Emerging Markets Multi-Asset Portfolio Adv (ABYEX)
12.03
-0.39
(-3.14%)
USD |
May 15 2026
Returns Chart
Key Stats
| Net Expense Ratio | Total Assets Under Management | Weighted Average Dividend Yield | Turnover Ratio (Generic) |
|---|---|---|---|
| 1.00% | 170.84M | 3.30% | 100.0% |
| 1 Year Fund Level Flows | 1 Year Total Returns (Daily) | Annualized Total Returns Since Inception (Daily) | Max Drawdown (Since Inception) |
| -11.45M | 36.36% |
Basic Info
| Investment Strategy | |
| The Fund seeks to maximize total return. The Fund invests at least 80% of its net assets under normal circumstances in securities of emerging market issuers and/or the currencies of emerging market countries. The Fund may invest up to 20% of its net assets in the securities of developed market issuers. |
| General | |
| Security Type | Mutual Fund |
| Equity Style | Large Cap Value |
| Broad Asset Class | Allocation |
| Broad Category | Allocation |
| Global Peer Group | Mixed Asset USD Aggressive |
| Peer Group | Emerging Markets Mixed-Asset Funds |
| Global Macro | Mixed Asset HC Aggressive |
| US Macro | Mixed-Assets Target Allocation Funds |
| YCharts Categorization | -- |
| YCharts Benchmark | -- |
| Prospectus Objective | Emerging Markets Mixed-Asset Funds |
| Fund Owner Firm Name | AllianceBernstein |
| Broad Asset Class Benchmark Index | |
| ^SPXTR | 100.0% |
Net Fund Flows Versus Peer Group
1 Month
% Rank:
79
-2.281M
Peer Group Low
887445.0
Peer Group High
1 Year
% Rank:
79
-11.45M
-11.45M
Peer Group Low
683507.0
Peer Group High
3 Months
% Rank:
79
-5.477M
Peer Group Low
783709.0
Peer Group High
3 Years
% Rank:
79
-41.91M
Peer Group Low
-6.505M
Peer Group High
6 Months
% Rank:
79
-6.558M
Peer Group Low
-385567.0
Peer Group High
5 Years
% Rank:
79
-70.47M
Peer Group Low
633317.0
Peer Group High
YTD
% Rank:
79
-5.258M
Peer Group Low
-384378.0
Peer Group High
10 Years
% Rank:
36
-6.550M
Peer Group Low
47.14M
Peer Group High
Date Unavailable
Risk
Performance Versus Peer Group
Annual Total Returns Versus Peers
As of May 16, 2026.
Asset Allocation
As of February 28, 2026.
| Type | % Net |
|---|---|
| Cash | 1.80% |
| Stock | 66.01% |
| Bond | 28.37% |
| Convertible | 0.00% |
| Preferred | 1.82% |
| Other | 2.00% |
Top 10 Holdings
| Name | % Weight | Price | % Change |
|---|---|---|---|
| Taiwan Semiconductor Manufacturing Co., Ltd. | 10.10% | 17.24 | 0.00% |
|
MSCI EMERG JUN6
|
8.25% | -- | -- |
|
BRL/Morgan Stanley IRS
|
5.56% | -- | -- |
| Samsung Electronics Co., Ltd. | 4.58% | 140.00 | 0.00% |
|
Interest Rate Swap General Security
|
3.49% | -- | -- |
|
HUF Forward Contract
|
3.07% | -- | -- |
| United States of America USGB 0.0 06/25/2026 FIX USD Government | 3.00% | 99.62 | 0.03% |
|
5YR T NOTE JUN26
|
3.00% | -- | -- |
|
COP Forward Contract
|
2.57% | -- | -- |
|
SK Hynix Inc ORD
|
2.44% | -- | -- |
Fees & Availability
| Fees | |
| Actual 12B-1 Fee | -- |
| Actual Management Fee | 0.45% |
| Administration Fee | -- |
| Maximum Front Load | -- |
| Maximum Deferred Load | -- |
| Maximum Redemption Fee | -- |
| General Availability | |
| Available for Insurance Product | No |
| Available for RRSP | No |
| Purchase Details | |
| Open to New Investors |
|
| Minimum Initial Investment | 0.00 None |
| Minimum Subsequent Investment | 0.00 None |
Basic Info
| Investment Strategy | |
| The Fund seeks to maximize total return. The Fund invests at least 80% of its net assets under normal circumstances in securities of emerging market issuers and/or the currencies of emerging market countries. The Fund may invest up to 20% of its net assets in the securities of developed market issuers. |
| General | |
| Security Type | Mutual Fund |
| Equity Style | Large Cap Value |
| Broad Asset Class | Allocation |
| Broad Category | Allocation |
| Global Peer Group | Mixed Asset USD Aggressive |
| Peer Group | Emerging Markets Mixed-Asset Funds |
| Global Macro | Mixed Asset HC Aggressive |
| US Macro | Mixed-Assets Target Allocation Funds |
| YCharts Categorization | -- |
| YCharts Benchmark | -- |
| Prospectus Objective | Emerging Markets Mixed-Asset Funds |
| Fund Owner Firm Name | AllianceBernstein |
| Broad Asset Class Benchmark Index | |
| ^SPXTR | 100.0% |
Fundamentals
| General | |
| Distribution Yield | -- |
| Dividend Yield TTM (5-14-26) | 2.87% |
| 30-Day SEC Yield | -- |
| 7-Day SEC Yield | -- |
| Number of Holdings | 428 |
| Stock | |
| Weighted Average PE Ratio | 21.08 |
| Weighted Average Price to Sales Ratio | 6.110 |
| Weighted Average Price to Book Ratio | 5.161 |
| Weighted Median ROE | 26.79% |
| Weighted Median ROA | 12.31% |
| ROI (TTM) | 20.56% |
| Return on Investment (TTM) | 20.56% |
| Earning Yield | 0.0681 |
| LT Debt / Shareholders Equity | 0.4165 |
| Number of Equity Holdings | 187 |
| Bond | |
| Yield to Maturity (2-28-26) | 6.54% |
| Effective Duration | -- |
| Average Coupon | 6.72% |
| Calculated Average Quality | 5.169 |
| Effective Maturity | 8.405 |
| Nominal Maturity | 8.736 |
| Number of Bond Holdings | 166 |
As of February 28, 2026
Growth Metrics
| EPS Growth (1Y) | 38.24% |
| EPS Growth (3Y) | 19.18% |
| EPS Growth (5Y) | 25.31% |
| Sales Growth (1Y) | 17.43% |
| Sales Growth (3Y) | 12.65% |
| Sales Growth (5Y) | 15.07% |
| Sales per Share Growth (1Y) | 17.57% |
| Sales per Share Growth (3Y) | 11.20% |
| Operating Cash Flow - Growth Rate (3Y) | 17.93% |
As of February 28, 2026
Top Portfolio Holders
| Name | % Weight |
|---|---|
| Portfolio A | 5.00% |
| Portfolio B | 3.50% |
| Portfolio C | 2.25% |
Excel Add-In Codes
| Name: =YCI("M:ABYEX", "name") |
| Broad Asset Class: =YCI("M:ABYEX", "broad_asset_class") |
| Broad Category: =YCI("M:ABYEX", "broad_category_group") |
| Prospectus Objective: =YCI("M:ABYEX", "prospectus_objective") |
| To find the codes for any of our securities and financial metrics, see our Complete Excel Reference. |