

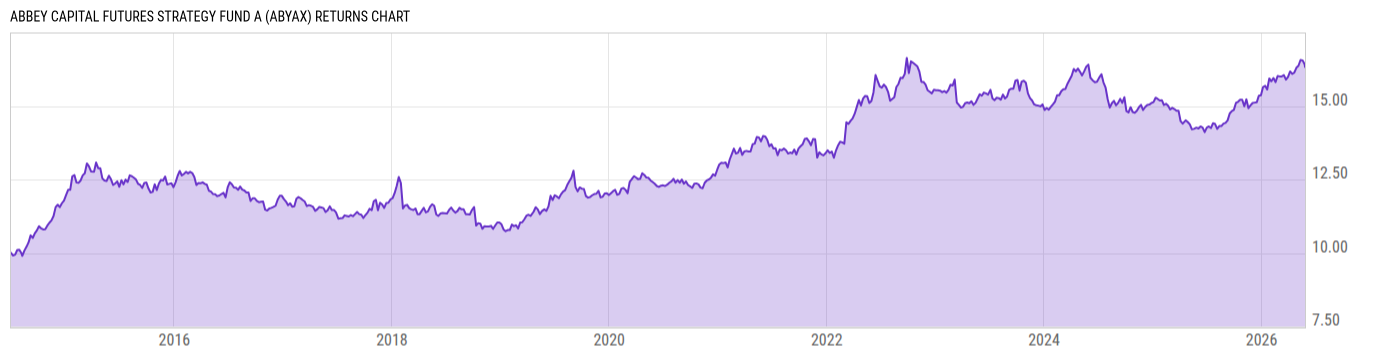
Abbey Capital Futures Strategy Fund A (ABYAX)
11.71
-0.06
(-0.51%)
USD |
May 27 2026
Returns Chart
Key Stats
| Net Expense Ratio | Total Assets Under Management | Weighted Average Dividend Yield | Turnover Ratio (Generic) |
|---|---|---|---|
| 2.04% | 2.527B | -- | 0.10% |
| 1 Year Fund Level Flows | 1 Year Total Returns (Daily) | Annualized Total Returns Since Inception (Daily) | Max Drawdown (Since Inception) |
| -263.36M | 14.48% |
Basic Info
| Investment Strategy | |
| The Fund seeks seeks long-term capital appreciation with current income as a secondary objective. The Fund will allocate its assets between a Managed Futures Strategy (invest 25% of its net assets in the Abbey Capital Offshore Fund Ltd.) and a Fixed Income Strategy (invest in investment-grade fixed income securities). |
| General | |
| Security Type | Mutual Fund |
| Equity Style | -- |
| Broad Asset Class | Alternative |
| Broad Category | Alternative Strategies |
| Global Peer Group | Alternative Managed Futures |
| Peer Group | Alternative Managed Futures Funds |
| Global Macro | Liquid Alternatives |
| US Macro | Alternative Equity Funds |
| YCharts Categorization | -- |
| YCharts Benchmark | -- |
| Prospectus Objective | Alternative Managed Futures Funds |
| Fund Owner Firm Name | Abbey Capital |
| Broad Asset Class Benchmark Index | |
| ^MSACWINTR | 100.0% |
Net Fund Flows Versus Peer Group
1 Month
% Rank:
10
-31.81M
Peer Group Low
423.86M
Peer Group High
1 Year
% Rank:
86
-263.36M
-1.239B
Peer Group Low
1.954B
Peer Group High
3 Months
% Rank:
17
-216.45M
Peer Group Low
1.057B
Peer Group High
3 Years
% Rank:
84
-2.228B
Peer Group Low
2.413B
Peer Group High
6 Months
% Rank:
88
-298.45M
Peer Group Low
1.394B
Peer Group High
5 Years
% Rank:
8
-561.65M
Peer Group Low
3.187B
Peer Group High
YTD
% Rank:
28
-82.90M
Peer Group Low
1.300B
Peer Group High
10 Years
% Rank:
5
-7.089B
Peer Group Low
3.218B
Peer Group High
Date Unavailable
Risk
Performance Versus Peer Group
Annual Total Returns Versus Peers
As of May 28, 2026.
Asset Allocation
As of March 31, 2026.
| Type | % Net |
|---|---|
| Cash | 0.84% |
| Stock | 0.00% |
| Bond | 50.37% |
| Convertible | 0.00% |
| Preferred | 0.00% |
| Other | 48.80% |
Top 10 Holdings
| Name | % Weight | Price | % Change |
|---|---|---|---|
|
Abbey Capital Futures Strategy Fund;I
|
22.29% | -- | -- |
| United States of America USGB 04/16/2026 FIX USD Government (Matured) | 8.80% | 100.00 | 0.01% |
| United States of America USGB 0.0 08/27/2026 FIX USD Government | 6.71% | 99.09 | 0.01% |
|
United States of America (Government) 0% 20-AUG-2026
|
5.80% | -- | -- |
| United States of America USGB 04/09/2026 FIX USD Government (Matured) | 5.20% | 100.00 | 0.01% |
| United States of America USGB 04/02/2026 FIX USD Government (Matured) | 3.87% | 100.00 | 0.01% |
| United States of America USGB 0.0 09/24/2026 FIX USD Government | 3.72% | 98.81 | 0.01% |
|
Abbey Futures Strategy Graham Onshore Fund
|
3.52% | -- | -- |
| United States of America USGB 04/30/2026 FIX USD Government (Matured) | 3.31% | 100.00 | 0.01% |
| United States of America USGB 0.0 06/04/2026 FIX USD Government | 3.07% | 99.93 | 0.01% |
Fees & Availability
| Fees | |
| Actual 12B-1 Fee | 0.25% |
| Actual Management Fee | 1.71% |
| Administration Fee | 3.40K% |
| Maximum Front Load | 5.75% |
| Maximum Deferred Load | -- |
| Maximum Redemption Fee | -- |
| General Availability | |
| Available for Insurance Product | No |
| Available for RRSP | No |
| Purchase Details | |
| Open to New Investors |
|
| Minimum Initial Investment | 2500.00 None |
| Minimum Subsequent Investment | 100.00 None |
Basic Info
| Investment Strategy | |
| The Fund seeks seeks long-term capital appreciation with current income as a secondary objective. The Fund will allocate its assets between a Managed Futures Strategy (invest 25% of its net assets in the Abbey Capital Offshore Fund Ltd.) and a Fixed Income Strategy (invest in investment-grade fixed income securities). |
| General | |
| Security Type | Mutual Fund |
| Equity Style | -- |
| Broad Asset Class | Alternative |
| Broad Category | Alternative Strategies |
| Global Peer Group | Alternative Managed Futures |
| Peer Group | Alternative Managed Futures Funds |
| Global Macro | Liquid Alternatives |
| US Macro | Alternative Equity Funds |
| YCharts Categorization | -- |
| YCharts Benchmark | -- |
| Prospectus Objective | Alternative Managed Futures Funds |
| Fund Owner Firm Name | Abbey Capital |
| Broad Asset Class Benchmark Index | |
| ^MSACWINTR | 100.0% |
Fundamentals
| General | |
| Distribution Yield | -- |
| Dividend Yield TTM (5-26-26) | 1.19% |
| 30-Day SEC Yield | -- |
| 7-Day SEC Yield | -- |
| Number of Holdings | 35 |
Top Portfolio Holders
| Name | % Weight |
|---|---|
| Portfolio A | 5.00% |
| Portfolio B | 3.50% |
| Portfolio C | 2.25% |
Excel Add-In Codes
| Name: =YCI("M:ABYAX", "name") |
| Broad Asset Class: =YCI("M:ABYAX", "broad_asset_class") |
| Broad Category: =YCI("M:ABYAX", "broad_category_group") |
| Prospectus Objective: =YCI("M:ABYAX", "prospectus_objective") |
| To find the codes for any of our securities and financial metrics, see our Complete Excel Reference. |