

AB CarVal Credit Opportunities Fund C (ABACX)
10.00
0.00 (0.00%)
USD |
May 21 2026
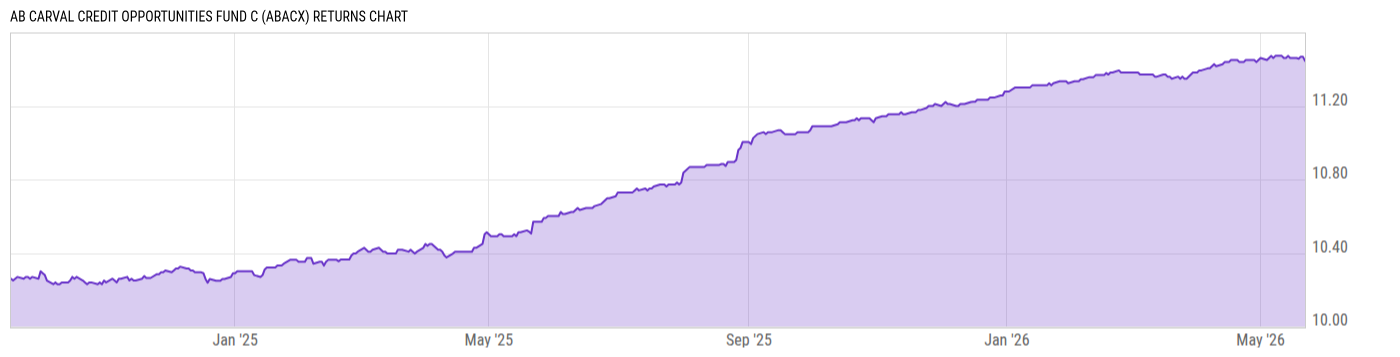
Returns Chart
Key Stats
| Net Expense Ratio | Total Assets Under Management | Weighted Average Dividend Yield | Turnover Ratio (Generic) |
|---|---|---|---|
| 3.28% | 490.31M | -- | 112.0% |
| 1 Year Fund Level Flows | 1 Year Total Returns (Daily) | Annualized Total Returns Since Inception (Daily) | Max Drawdown (Since Inception) |
| -- | 9.16% |
Basic Info
| Investment Strategy | |
| The Fund seeks to maximize total return, consisting of current income and capital appreciation. Under normal circumstances, the Fund will primarily invest in credit-related investments, either directly or through separate investment structures or vehicles that provide the Fund with exposure to such securities. |
| General | |
| Security Type | Unlisted Closed-End Fund |
| Equity Style | -- |
| Broad Asset Class | Taxable Bond |
| Broad Category | Fixed Income |
| Global Peer Group | Bond USD High Yield |
| Peer Group | High Yield Funds |
| Global Macro | Bond High Yield |
| US Macro | High Yield Funds |
| YCharts Categorization | -- |
| YCharts Benchmark | -- |
| Prospectus Objective | High Yield Funds |
| Fund Owner Firm Name | AllianceBernstein |
| Broad Asset Class Benchmark Index | |
| ^BBUSATR | 100.0% |
Net Fund Flows Versus Peer Group
1 Month
% Rank:
--
-246.22M
Peer Group Low
1.905B
Peer Group High
1 Year
% Rank:
--
-2.757B
Peer Group Low
12.05B
Peer Group High
3 Months
% Rank:
--
-1.206B
Peer Group Low
754.76M
Peer Group High
3 Years
% Rank:
--
-4.269B
Peer Group Low
12.80B
Peer Group High
6 Months
% Rank:
--
-2.219B
Peer Group Low
1.746B
Peer Group High
5 Years
% Rank:
--
-7.728B
Peer Group Low
14.73B
Peer Group High
YTD
% Rank:
--
-3.074B
Peer Group Low
1.049B
Peer Group High
10 Years
% Rank:
--
-10.71B
Peer Group Low
21.54B
Peer Group High
Date Unavailable
Risk
Performance Versus Peer Group
Annual Total Returns Versus Peers
As of May 22, 2026.
Asset Allocation
As of December 31, 2025.
| Type | % Net |
|---|---|
| Cash | 1.93% |
| Stock | 33.39% |
| Bond | 55.72% |
| Convertible | 0.00% |
| Preferred | 0.04% |
| Other | 8.91% |
Top 10 Holdings
| Name | % Weight | Price | % Change |
|---|---|---|---|
|
Northern Institutional Treasury Prem
|
6.04% | -- | -- |
|
Aergo Capital Ltd
|
6.01% | -- | -- |
|
Powis Finance SARL
|
3.57% | -- | -- |
|
Renascentia Spv Srl
|
3.20% | -- | -- |
|
Asker Sarl
|
2.73% | -- | -- |
|
Lendbuzz Auto Receivables Trust 15-Aug-2031
|
2.54% | -- | -- |
|
Creditable Opportunities Fund II
|
2.32% | -- | -- |
|
CVI SYM Holdings LLC
|
2.30% | -- | -- |
|
USD Cash
|
1.93% | -- | -- |
|
CVI OCT Acquisition Trust
|
1.91% | -- | -- |
Fees & Availability
| Fees | |
| Actual 12B-1 Fee | 1.00% |
| Actual Management Fee | 1.09% |
| Administration Fee | 19.00% |
| Maximum Front Load | -- |
| Maximum Deferred Load | 1.00% |
| Maximum Redemption Fee | -- |
| General Availability | |
| Available for Insurance Product | No |
| Available for RRSP | No |
| Purchase Details | |
| Open to New Investors |
|
| Minimum Initial Investment | 2500.00 None |
| Minimum Subsequent Investment | 50.00 None |
Basic Info
| Investment Strategy | |
| The Fund seeks to maximize total return, consisting of current income and capital appreciation. Under normal circumstances, the Fund will primarily invest in credit-related investments, either directly or through separate investment structures or vehicles that provide the Fund with exposure to such securities. |
| General | |
| Security Type | Unlisted Closed-End Fund |
| Equity Style | -- |
| Broad Asset Class | Taxable Bond |
| Broad Category | Fixed Income |
| Global Peer Group | Bond USD High Yield |
| Peer Group | High Yield Funds |
| Global Macro | Bond High Yield |
| US Macro | High Yield Funds |
| YCharts Categorization | -- |
| YCharts Benchmark | -- |
| Prospectus Objective | High Yield Funds |
| Fund Owner Firm Name | AllianceBernstein |
| Broad Asset Class Benchmark Index | |
| ^BBUSATR | 100.0% |
Fundamentals
| General | |
| Distribution Yield | -- |
| Dividend Yield TTM (5-20-26) | 6.05% |
| 30-Day SEC Yield | -- |
| 7-Day SEC Yield | -- |
| Number of Holdings | 215 |
| Stock | |
| Weighted Average PE Ratio | -- |
| Weighted Average Price to Sales Ratio | -- |
| Weighted Average Price to Book Ratio | -- |
| Weighted Median ROE | -- |
| Weighted Median ROA | -- |
| ROI (TTM) | -- |
| Return on Investment (TTM) | -- |
| Earning Yield | -- |
| LT Debt / Shareholders Equity | -- |
| Number of Equity Holdings | 24 |
| Bond | |
| Yield to Maturity (12-31-25) | 5.27% |
| Effective Duration | 2.07 |
| Average Coupon | 7.52% |
| Calculated Average Quality | 5.423 |
| Effective Maturity | 16.13 |
| Nominal Maturity | 16.24 |
| Number of Bond Holdings | 177 |
As of December 31, 2025
Growth Metrics
| EPS Growth (1Y) | -- |
| EPS Growth (3Y) | -- |
| EPS Growth (5Y) | -- |
| Sales Growth (1Y) | -- |
| Sales Growth (3Y) | -- |
| Sales Growth (5Y) | -- |
| Sales per Share Growth (1Y) | -- |
| Sales per Share Growth (3Y) | -- |
| Operating Cash Flow - Growth Rate (3Y) | -- |
As of December 31, 2025
Top Portfolio Holders
| Name | % Weight |
|---|---|
| Portfolio A | 5.00% |
| Portfolio B | 3.50% |
| Portfolio C | 2.25% |