

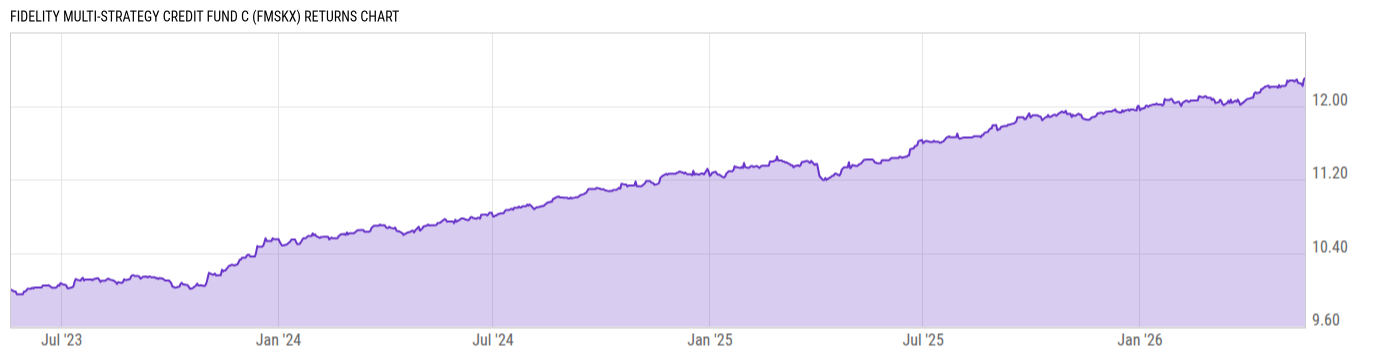
Fidelity Multi-Strategy Credit Fund C (FMSKX)
10.40
+0.01
(+0.10%)
USD |
May 21 2026
Returns Chart
Key Stats
| Net Expense Ratio | Total Assets Under Management | Weighted Average Dividend Yield | Turnover Ratio (Generic) |
|---|---|---|---|
| 5.62% | 56.55M | -- | 53.00% |
| 1 Year Fund Level Flows | 1 Year Total Returns (Daily) | Annualized Total Returns Since Inception (Daily) | Max Drawdown (Since Inception) |
| -- | 8.05% |
Basic Info
| Investment Strategy | |
| The Fund seeks high level of current income and capital appreciation through investments across a variety of high income-oriented asset classes including both liquid and illiquid securities. It employs a multi-credit strategy that seeks to opportunistically rotate across the entire credit spectrum throughout market cycle. |
| General | |
| Security Type | Unlisted Closed-End Fund |
| Equity Style | -- |
| Broad Asset Class | Taxable Bond |
| Broad Category | Fixed Income |
| Global Peer Group | Bond Global USD |
| Peer Group | Global Income Funds |
| Global Macro | Bond Global |
| US Macro | World Income Funds |
| YCharts Categorization | -- |
| YCharts Benchmark | -- |
| Prospectus Objective | Global Income Funds |
| Fund Owner Firm Name | Fidelity Investments |
| Broad Asset Class Benchmark Index | |
| ^BBUSATR | 100.0% |
Net Fund Flows Versus Peer Group
1 Month
% Rank:
--
-312.18M
Peer Group Low
211.27M
Peer Group High
1 Year
% Rank:
--
-1.130B
Peer Group Low
1.493B
Peer Group High
3 Months
% Rank:
--
-461.90M
Peer Group Low
567.54M
Peer Group High
3 Years
% Rank:
--
-2.542B
Peer Group Low
2.711B
Peer Group High
6 Months
% Rank:
--
-771.56M
Peer Group Low
851.14M
Peer Group High
5 Years
% Rank:
--
-8.824B
Peer Group Low
3.278B
Peer Group High
YTD
% Rank:
--
-485.30M
Peer Group Low
617.06M
Peer Group High
10 Years
% Rank:
--
-48.28B
Peer Group Low
4.453B
Peer Group High
Date Unavailable
Risk
Performance Versus Peer Group
Annual Total Returns Versus Peers
As of May 22, 2026.
Asset Allocation
As of February 28, 2026.
| Type | % Net |
|---|---|
| Cash | 4.02% |
| Stock | 0.16% |
| Bond | 48.13% |
| Convertible | 0.00% |
| Preferred | 1.65% |
| Other | 46.04% |
Top 10 Holdings
| Name | % Weight | Price | % Change |
|---|---|---|---|
|
Fidelity Private Credit Fund
|
44.09% | -- | -- |
|
Fidelity Cash Central Fund
|
7.50% | -- | -- |
|
Other Assets less Liabilities
|
1.40% | -- | -- |
| Strategy Inc STRATEAA 10.0 12/31/2099 FIX USD Corporate | 1.12% | 99.86 | 0.00% |
|
Brazil, Federative Republic of (Government) 10% 01-JAN-2027
|
0.87% | -- | -- |
| JPMorgan Chase & Co. JPM 6.5 12/31/2099 FLT USD Corporate '30 | 0.74% | 101.60 | 0.02% |
| Enbridge Inc. ENB 8.5 01/15/2084 FLT USD Corporate '34 | 0.70% | 113.74 | 0.04% |
| JPMorgan Chase & Co. JPM 6.43675 12/31/2099 FLT USD Corporate '25 | 0.69% | 100.20 | 0.07% |
| ENERGY TRANSFER LP ENERTRAE 6.625 12/31/2099 FLT USD Corporate '28 | 0.59% | 100.99 | 0.04% |
| SUNOCO LP SUNOLP 7.875 12/31/2099 FLT USD Corporate 144A '30 | 0.58% | 103.86 | 0.14% |
Fees & Availability
| Fees | |
| Actual 12B-1 Fee | 1.00% |
| Actual Management Fee | 0.54% |
| Administration Fee | -- |
| Maximum Front Load | -- |
| Maximum Deferred Load | 1.00% |
| Maximum Redemption Fee | -- |
| General Availability | |
| Available for Insurance Product | No |
| Available for RRSP | No |
| Purchase Details | |
| Open to New Investors |
|
| Minimum Initial Investment | 2500.00 None |
| Minimum Subsequent Investment | 0.00 None |
Basic Info
| Investment Strategy | |
| The Fund seeks high level of current income and capital appreciation through investments across a variety of high income-oriented asset classes including both liquid and illiquid securities. It employs a multi-credit strategy that seeks to opportunistically rotate across the entire credit spectrum throughout market cycle. |
| General | |
| Security Type | Unlisted Closed-End Fund |
| Equity Style | -- |
| Broad Asset Class | Taxable Bond |
| Broad Category | Fixed Income |
| Global Peer Group | Bond Global USD |
| Peer Group | Global Income Funds |
| Global Macro | Bond Global |
| US Macro | World Income Funds |
| YCharts Categorization | -- |
| YCharts Benchmark | -- |
| Prospectus Objective | Global Income Funds |
| Fund Owner Firm Name | Fidelity Investments |
| Broad Asset Class Benchmark Index | |
| ^BBUSATR | 100.0% |
Fundamentals
| General | |
| Distribution Yield | -- |
| Dividend Yield TTM (5-21-26) | 5.05% |
| 30-Day SEC Yield (4-30-26) | 4.78% |
| 7-Day SEC Yield | -- |
| Number of Holdings | 353 |
Top Portfolio Holders
| Name | % Weight |
|---|---|
| Portfolio A | 5.00% |
| Portfolio B | 3.50% |
| Portfolio C | 2.25% |