

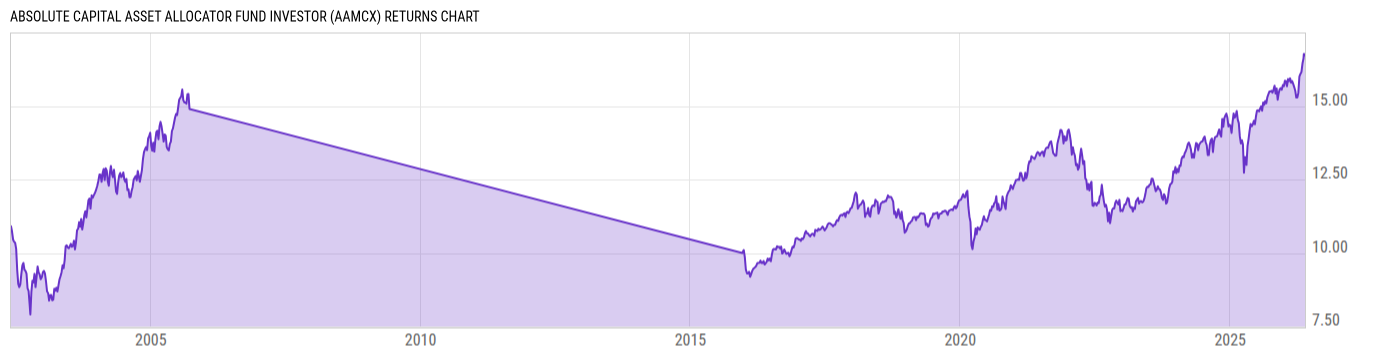
Absolute Capital Asset Allocator Fund Investor (AAMCX)
12.35
+0.04
(+0.32%)
USD |
May 22 2026
Returns Chart
Key Stats
| Net Expense Ratio | Total Assets Under Management | Weighted Average Dividend Yield | Turnover Ratio (Generic) |
|---|---|---|---|
| 2.57% | 75.34M | -- | 207.0% |
| 1 Year Fund Level Flows | 1 Year Total Returns (Daily) | Annualized Total Returns Since Inception (Daily) | Max Drawdown (Since Inception) |
| 13.98M | 18.50% |
Basic Info
| Investment Strategy | |
| The Fund seeks long term capital appreciation. It invests directly or indirectly through other investment companies, including mutual funds, ETFs and closed-end funds in domestic and foreign (I) fixed income securities of any maturity or credit quality; (ii) equity securities of any market capitalization; and (iii) ETNs. |
| General | |
| Security Type | Mutual Fund |
| Equity Style | -- |
| Broad Asset Class | Allocation |
| Broad Category | Allocation |
| Global Peer Group | Mixed Asset USD Flexible - Global |
| Peer Group | Flexible Portfolio Funds |
| Global Macro | Mixed Asset HC Flexible |
| US Macro | Mixed-Assets Funds |
| YCharts Categorization | -- |
| YCharts Benchmark | -- |
| Prospectus Objective | Flexible Portfolio Funds |
| Fund Owner Firm Name | Absolute Capital |
| Broad Asset Class Benchmark Index | |
| ^SPXTR | 100.0% |
Net Fund Flows Versus Peer Group
1 Month
% Rank:
25
-159.25M
Peer Group Low
5.297B
Peer Group High
1 Year
% Rank:
21
13.98M
-3.214B
Peer Group Low
5.297B
Peer Group High
3 Months
% Rank:
19
-582.29M
Peer Group Low
5.297B
Peer Group High
3 Years
% Rank:
19
-12.12B
Peer Group Low
5.297B
Peer Group High
6 Months
% Rank:
21
-1.396B
Peer Group Low
5.297B
Peer Group High
5 Years
% Rank:
23
-14.74B
Peer Group Low
5.297B
Peer Group High
YTD
% Rank:
22
-927.39M
Peer Group Low
5.297B
Peer Group High
10 Years
% Rank:
33
-47.38B
Peer Group Low
9.619B
Peer Group High
Date Unavailable
Risk
Performance Versus Peer Group
Annual Total Returns Versus Peers
As of May 23, 2026.
Asset Allocation
As of March 31, 2026.
| Type | % Net |
|---|---|
| Cash | 7.98% |
| Stock | 75.87% |
| Bond | 16.09% |
| Convertible | 0.00% |
| Preferred | 0.05% |
| Other | 0.01% |
Top 10 Holdings
| Name | % Weight | Price | % Change |
|---|---|---|---|
| First American Government Obligations Fd X | 12.10% | 1.00 | 0.00% |
| iShares Core Dividend ETF | 7.53% | 60.87 | 2.15% |
| Vanguard S&P 500 Growth Index Fund ETF | 7.25% | 82.11 | -0.01% |
| State Street SPDR S&P 1500 Value TILT ETF | 6.46% | 235.75 | 0.79% |
| United States of America USGB 0.0 06/04/2026 FIX USD Government | 6.31% | 99.90 | 0.03% |
| State Street Technology Select Sector SPDR ETF | 5.58% | 180.39 | 1.00% |
| Vanguard Communication Services Index Fund ETF | 5.51% | 195.55 | -0.17% |
| State Street SPDR Portfolio S&P 500 ETF | 4.55% | 87.75 | 0.38% |
| Vanguard FTSE All-World ex US Index Fund ETF | 4.48% | 82.44 | -0.17% |
| Quanta Services, Inc. | 3.63% | 723.44 | 0.91% |
Fees & Availability
| Fees | |
| Actual 12B-1 Fee | 1.00% |
| Actual Management Fee | 1.00% |
| Administration Fee | -- |
| Maximum Front Load | -- |
| Maximum Deferred Load | -- |
| Maximum Redemption Fee | -- |
| General Availability | |
| Available for Insurance Product | No |
| Available for RRSP | No |
| Purchase Details | |
| Open to New Investors |
|
| Minimum Initial Investment | 2500.00 None |
| Minimum Subsequent Investment | 100.00 None |
Basic Info
| Investment Strategy | |
| The Fund seeks long term capital appreciation. It invests directly or indirectly through other investment companies, including mutual funds, ETFs and closed-end funds in domestic and foreign (I) fixed income securities of any maturity or credit quality; (ii) equity securities of any market capitalization; and (iii) ETNs. |
| General | |
| Security Type | Mutual Fund |
| Equity Style | -- |
| Broad Asset Class | Allocation |
| Broad Category | Allocation |
| Global Peer Group | Mixed Asset USD Flexible - Global |
| Peer Group | Flexible Portfolio Funds |
| Global Macro | Mixed Asset HC Flexible |
| US Macro | Mixed-Assets Funds |
| YCharts Categorization | -- |
| YCharts Benchmark | -- |
| Prospectus Objective | Flexible Portfolio Funds |
| Fund Owner Firm Name | Absolute Capital |
| Broad Asset Class Benchmark Index | |
| ^SPXTR | 100.0% |
Fundamentals
| General | |
| Distribution Yield | -- |
| Dividend Yield TTM (5-21-26) | 0.08% |
| 30-Day SEC Yield | -- |
| 7-Day SEC Yield | -- |
| Number of Holdings | 10 |
| Stock | |
| Weighted Average PE Ratio | 29.13 |
| Weighted Average Price to Sales Ratio | 6.541 |
| Weighted Average Price to Book Ratio | 8.382 |
| Weighted Median ROE | 58.96% |
| Weighted Median ROA | 11.06% |
| ROI (TTM) | 17.15% |
| Return on Investment (TTM) | 17.15% |
| Earning Yield | 0.0460 |
| LT Debt / Shareholders Equity | 0.8805 |
| Number of Equity Holdings | 1 |
| Bond | |
| Yield to Maturity (3-31-26) | 4.01% |
| Effective Duration | -- |
| Average Coupon | 5.27% |
| Calculated Average Quality | 1.032 |
| Effective Maturity | 3.420 |
| Nominal Maturity | 3.420 |
| Number of Bond Holdings | 1 |
As of March 31, 2026
Growth Metrics
| EPS Growth (1Y) | 18.72% |
| EPS Growth (3Y) | 17.86% |
| EPS Growth (5Y) | 19.98% |
| Sales Growth (1Y) | 12.37% |
| Sales Growth (3Y) | 13.15% |
| Sales Growth (5Y) | 14.26% |
| Sales per Share Growth (1Y) | 52.48% |
| Sales per Share Growth (3Y) | 14.36% |
| Operating Cash Flow - Growth Rate (3Y) | 22.29% |
As of March 31, 2026
Top Portfolio Holders
| Name | % Weight |
|---|---|
| Portfolio A | 5.00% |
| Portfolio B | 3.50% |
| Portfolio C | 2.25% |
Excel Add-In Codes
| Name: =YCI("M:AAMCX", "name") |
| Broad Asset Class: =YCI("M:AAMCX", "broad_asset_class") |
| Broad Category: =YCI("M:AAMCX", "broad_category_group") |
| Prospectus Objective: =YCI("M:AAMCX", "prospectus_objective") |
| To find the codes for any of our securities and financial metrics, see our Complete Excel Reference. |