

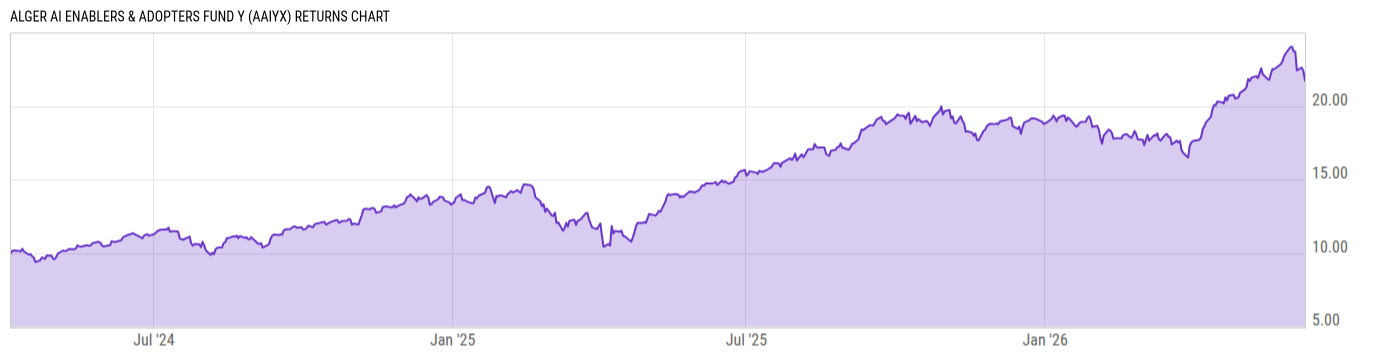
Alger AI Enablers & Adopters Fund Y (AAIYX)
19.96
-0.60
(-2.92%)
USD |
Jun 10 2026
Returns Chart
Key Stats
| Net Expense Ratio | Total Assets Under Management | Weighted Average Dividend Yield | Turnover Ratio (Generic) |
|---|---|---|---|
| 0.61% | 24.72M | 0.22% | 174.0% |
| 1 Year Fund Level Flows | 1 Year Total Returns (Daily) | Annualized Total Returns Since Inception (Daily) | Max Drawdown (Since Inception) |
| 11.40M | 47.28% |
Basic Info
| Investment Strategy | |
| The Fund seeks long-term capital appreciation. Investing at least 80% of its net assets, borrowings for investment purposes, in equity securities of companies of any market capitalization that believes will benefit from AI, demonstrate growth potential, & companies where AI can play a role in driving stock price. |
| General | |
| Security Type | Mutual Fund |
| Equity Style | Large Cap Growth |
| Broad Asset Class | Sector Equity |
| Broad Category | Equity |
| Global Peer Group | Equity Sector Information Technology |
| Peer Group | Global Science/Technology Funds |
| Global Macro | Equity Industry Sector |
| US Macro | World Sector Equity Funds |
| YCharts Categorization | -- |
| YCharts Benchmark | -- |
| Prospectus Objective | Global Science/Technology Funds |
| Fund Owner Firm Name | Alger |
| Broad Asset Class Benchmark Index | |
| ^MSWNTR | 100.0% |
Net Fund Flows Versus Peer Group
1 Month
% Rank:
43
-151.07M
Peer Group Low
2.117B
Peer Group High
1 Year
% Rank:
37
11.40M
-1.019B
Peer Group Low
9.085B
Peer Group High
3 Months
% Rank:
44
-328.72M
Peer Group Low
2.658B
Peer Group High
3 Years
% Rank:
39
-1.707B
Peer Group Low
10.80B
Peer Group High
6 Months
% Rank:
37
-744.53M
Peer Group Low
3.490B
Peer Group High
5 Years
% Rank:
46
-3.665B
Peer Group Low
10.80B
Peer Group High
YTD
% Rank:
41
-491.87M
Peer Group Low
3.238B
Peer Group High
10 Years
% Rank:
74
-3.052B
Peer Group Low
11.78B
Peer Group High
Date Unavailable
Risk
Performance Versus Peer Group
Annual Total Returns Versus Peers
As of June 11, 2026.
Asset Allocation
As of February 28, 2026.
| Type | % Net |
|---|---|
| Cash | 3.38% |
| Stock | 92.00% |
| Bond | 0.00% |
| Convertible | 0.00% |
| Preferred | 4.62% |
| Other | 0.00% |
Top 10 Holdings
| Name | % Weight | Price | % Change |
|---|---|---|---|
| NVIDIA Corp. | 13.83% | 201.77 | 0.67% |
| Microsoft Corp. | 7.19% | 388.50 | -2.23% |
| Amazon.com, Inc. | 6.72% | 237.75 | -0.11% |
| Taiwan Semiconductor Manufacturing Co., Ltd. | 6.43% | 413.29 | 1.11% |
| Alphabet, Inc. | 6.31% | 347.01 | -1.79% |
| Apple, Inc. | 4.46% | 293.45 | 0.64% |
| Western Digital Corp. | 4.39% | 507.06 | 3.46% |
| Meta Platforms, Inc. | 4.27% | 564.39 | -1.15% |
| Nebius Group NV | 4.00% | 215.62 | 1.86% |
| Tesla, Inc. | 3.76% | 386.60 | 1.31% |
Fees & Availability
| Fees | |
| Actual 12B-1 Fee | -- |
| Actual Management Fee | 0.06% |
| Administration Fee | 40.00% |
| Maximum Front Load | -- |
| Maximum Deferred Load | -- |
| Maximum Redemption Fee | -- |
| General Availability | |
| Available for Insurance Product | No |
| Available for RRSP | No |
| Purchase Details | |
| Open to New Investors |
|
| Minimum Initial Investment | 500000.0 None |
| Minimum Subsequent Investment | 0.00 None |
Basic Info
| Investment Strategy | |
| The Fund seeks long-term capital appreciation. Investing at least 80% of its net assets, borrowings for investment purposes, in equity securities of companies of any market capitalization that believes will benefit from AI, demonstrate growth potential, & companies where AI can play a role in driving stock price. |
| General | |
| Security Type | Mutual Fund |
| Equity Style | Large Cap Growth |
| Broad Asset Class | Sector Equity |
| Broad Category | Equity |
| Global Peer Group | Equity Sector Information Technology |
| Peer Group | Global Science/Technology Funds |
| Global Macro | Equity Industry Sector |
| US Macro | World Sector Equity Funds |
| YCharts Categorization | -- |
| YCharts Benchmark | -- |
| Prospectus Objective | Global Science/Technology Funds |
| Fund Owner Firm Name | Alger |
| Broad Asset Class Benchmark Index | |
| ^MSWNTR | 100.0% |
Fundamentals
| General | |
| Distribution Yield | -- |
| Dividend Yield TTM (6-10-26) | 0.00% |
| 30-Day SEC Yield | -- |
| 7-Day SEC Yield | -- |
| Number of Holdings | 55 |
| Stock | |
| Weighted Average PE Ratio | 38.86 |
| Weighted Average Price to Sales Ratio | 11.92 |
| Weighted Average Price to Book Ratio | 14.01 |
| Weighted Median ROE | 48.18% |
| Weighted Median ROA | 25.18% |
| ROI (TTM) | 32.10% |
| Return on Investment (TTM) | 32.10% |
| Earning Yield | 0.0286 |
| LT Debt / Shareholders Equity | 0.5287 |
| Number of Equity Holdings | 53 |
As of February 28, 2026
Growth Metrics
| EPS Growth (1Y) | 44.96% |
| EPS Growth (3Y) | 33.41% |
| EPS Growth (5Y) | 38.86% |
| Sales Growth (1Y) | 34.47% |
| Sales Growth (3Y) | 31.41% |
| Sales Growth (5Y) | 23.62% |
| Sales per Share Growth (1Y) | 44.36% |
| Sales per Share Growth (3Y) | 39.40% |
| Operating Cash Flow - Growth Rate (3Y) | 60.05% |
As of February 28, 2026
Fund Details
Top Portfolio Holders
| Name | % Weight |
|---|---|
| Portfolio A | 5.00% |
| Portfolio B | 3.50% |
| Portfolio C | 2.25% |
Excel Add-In Codes
| Name: =YCI("M:AAIYX", "name") |
| Broad Asset Class: =YCI("M:AAIYX", "broad_asset_class") |
| Broad Category: =YCI("M:AAIYX", "broad_category_group") |
| Prospectus Objective: =YCI("M:AAIYX", "prospectus_objective") |
| To find the codes for any of our securities and financial metrics, see our Complete Excel Reference. |