

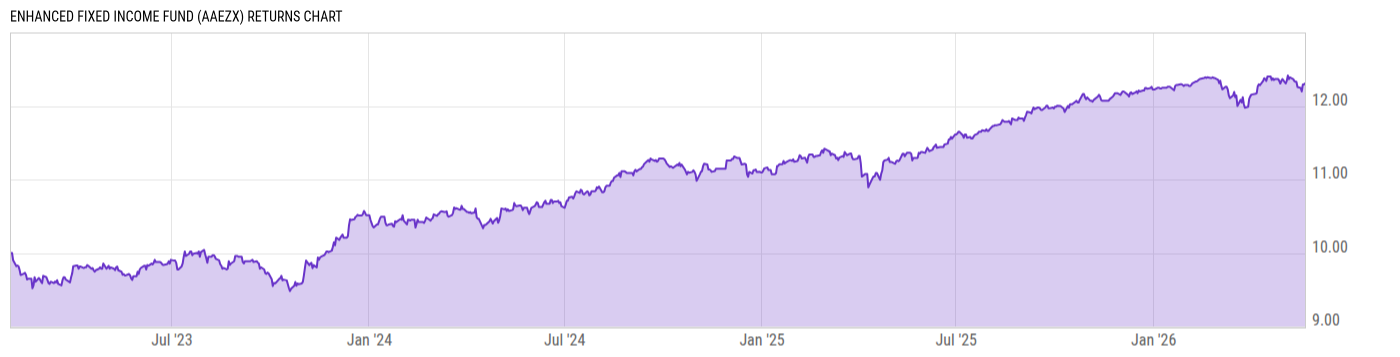
Enhanced Fixed Income Fund (AAEZX)
10.34
+0.02
(+0.19%)
USD |
Jun 09 2026
Returns Chart
Key Stats
| Net Expense Ratio | Total Assets Under Management | Weighted Average Dividend Yield | Turnover Ratio (Generic) |
|---|---|---|---|
| 0.76% | 48.08M | -- | 99.00% |
| 1 Year Fund Level Flows | 1 Year Total Returns (Daily) | Annualized Total Returns Since Inception (Daily) | Max Drawdown (Since Inception) |
| 34.06M | 8.50% |
Basic Info
| Investment Strategy | |
| The Fund seeks total return. It invests 80% of its net assets in fixed income securities or ETFs that provide exposure to fixed income securities. It invests in a portfolio of securities designed to track performance of one or more indexes that represents broad exposure to both High Yield Index & Emerging Market index. |
| General | |
| Security Type | Mutual Fund |
| Equity Style | -- |
| Broad Asset Class | Taxable Bond |
| Broad Category | Fixed Income |
| Global Peer Group | Bond Global High Yield USD |
| Peer Group | Global High Yield Funds |
| Global Macro | Bond High Yield |
| US Macro | High Yield Funds |
| YCharts Categorization | -- |
| YCharts Benchmark | -- |
| Prospectus Objective | Global High Yield Funds |
| Fund Owner Firm Name | SEI |
| Broad Asset Class Benchmark Index | |
| ^BBUSATR | 100.0% |
Net Fund Flows Versus Peer Group
1 Month
% Rank:
47
-102.99M
Peer Group Low
269.98M
Peer Group High
1 Year
% Rank:
14
34.06M
-208.83M
Peer Group Low
269.98M
Peer Group High
3 Months
% Rank:
24
-140.79M
Peer Group Low
269.98M
Peer Group High
3 Years
% Rank:
39
-1.177B
Peer Group Low
1.062B
Peer Group High
6 Months
% Rank:
22
-491.00M
Peer Group Low
269.98M
Peer Group High
5 Years
% Rank:
19
-2.590B
Peer Group Low
2.289B
Peer Group High
YTD
% Rank:
29
-303.35M
Peer Group Low
269.98M
Peer Group High
10 Years
% Rank:
24
-5.038B
Peer Group Low
2.289B
Peer Group High
Date Unavailable
Risk
Performance Versus Peer Group
Annual Total Returns Versus Peers
As of June 10, 2026.
Asset Allocation
As of January 31, 2026.
| Type | % Net |
|---|---|
| Cash | 2.04% |
| Stock | 0.02% |
| Bond | 96.63% |
| Convertible | 0.00% |
| Preferred | 0.00% |
| Other | 1.31% |
Top 5 Holdings
| Name | % Weight | Price | % Change |
|---|---|---|---|
| State Street SPDR Portfolio High Yield Bond ETF | 48.96% | 23.28 | -0.15% |
| State Street SPDR Bloomberg Emerg Mkts USD Bd ETF | 48.55% | 25.10 | -0.40% |
| SEI Government Fund Institutional | 1.34% | 1.00 | 0.00% |
|
USD Cash
|
1.19% | -- | -- |
|
Other Assets less Liabilities
|
-0.04% | -- | -- |
Fees & Availability
| Fees | |
| Actual 12B-1 Fee | -- |
| Actual Management Fee | 0.10% |
| Administration Fee | -- |
| Maximum Front Load | -- |
| Maximum Deferred Load | -- |
| Maximum Redemption Fee | -- |
| General Availability | |
| Available for Insurance Product | No |
| Available for RRSP | No |
| Purchase Details | |
| Open to New Investors |
|
| Minimum Initial Investment | 0.00 None |
| Minimum Subsequent Investment | 0.00 None |
Basic Info
| Investment Strategy | |
| The Fund seeks total return. It invests 80% of its net assets in fixed income securities or ETFs that provide exposure to fixed income securities. It invests in a portfolio of securities designed to track performance of one or more indexes that represents broad exposure to both High Yield Index & Emerging Market index. |
| General | |
| Security Type | Mutual Fund |
| Equity Style | -- |
| Broad Asset Class | Taxable Bond |
| Broad Category | Fixed Income |
| Global Peer Group | Bond Global High Yield USD |
| Peer Group | Global High Yield Funds |
| Global Macro | Bond High Yield |
| US Macro | High Yield Funds |
| YCharts Categorization | -- |
| YCharts Benchmark | -- |
| Prospectus Objective | Global High Yield Funds |
| Fund Owner Firm Name | SEI |
| Broad Asset Class Benchmark Index | |
| ^BBUSATR | 100.0% |
Fundamentals
| General | |
| Distribution Yield | -- |
| Dividend Yield TTM (6-8-26) | 4.63% |
| 30-Day SEC Yield | -- |
| 7-Day SEC Yield | -- |
| Number of Holdings | 5 |
| Bond | |
| Yield to Maturity (1-31-26) | 5.66% |
| Effective Duration | -- |
| Average Coupon | 6.11% |
| Calculated Average Quality | 4.953 |
| Effective Maturity | 7.837 |
| Nominal Maturity | 8.371 |
| Number of Bond Holdings | 0 |
As of January 31, 2026
Fund Details
| Key Dates | |
| Inception Date | 2/1/2023 |
| Last Annual Report Date | 7/31/2025 |
| Last Prospectus Date | 11/30/2025 |
| Attributes | |
| Index Fund |
|
| Inverse Fund | No |
| Leveraged Fund | -- |
| Fund of Funds | No |
| Currency Hedged Fund | -- |
| Socially Responsible Fund | No |
Top Portfolio Holders
| Name | % Weight |
|---|---|
| Portfolio A | 5.00% |
| Portfolio B | 3.50% |
| Portfolio C | 2.25% |
Excel Add-In Codes
| Name: =YCI("M:AAEZX", "name") |
| Broad Asset Class: =YCI("M:AAEZX", "broad_asset_class") |
| Broad Category: =YCI("M:AAEZX", "broad_category_group") |
| Prospectus Objective: =YCI("M:AAEZX", "prospectus_objective") |
| To find the codes for any of our securities and financial metrics, see our Complete Excel Reference. |