

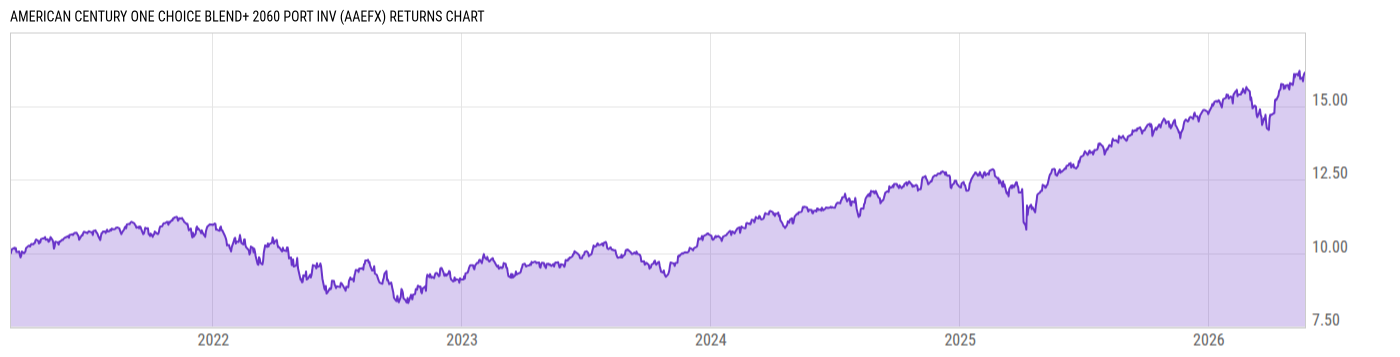
American Century One Choice Blend+ 2060 Port Inv (AAEFX)
14.05
+0.03
(+0.21%)
USD |
May 22 2026
Returns Chart
Key Stats
| Net Expense Ratio | Total Assets Under Management | Weighted Average Dividend Yield | Turnover Ratio (Generic) |
|---|---|---|---|
| 0.59% | 100.21M | -- | 17.00% |
| 1 Year Fund Level Flows | 1 Year Total Returns (Daily) | Annualized Total Returns Since Inception (Daily) | Max Drawdown (Since Inception) |
| 58.31M | 27.45% |
Basic Info
| Investment Strategy | |
| The Fund seeks the highest total return consistent with its asset mix. It is a fund of funds which invests in American Century mutual funds that represent a variety of asset classes and investment styles. It assumes a retirement age of 65 and may not be appropriate for an investor who plans to retire at the target date. |
| General | |
| Security Type | Mutual Fund |
| Equity Style | -- |
| Broad Asset Class | Allocation |
| Broad Category | Allocation |
| Global Peer Group | Target Maturity MA USD 2060 |
| Peer Group | Mixed-Asset Target 2060 Funds |
| Global Macro | Target Maturity |
| US Macro | Mixed-Assets Target Date Funds |
| YCharts Categorization | -- |
| YCharts Benchmark | -- |
| Prospectus Objective | Growth Funds |
| Fund Owner Firm Name | American Century Investments |
| Broad Asset Class Benchmark Index | |
| ^SPXTR | 100.0% |
Net Fund Flows Versus Peer Group
1 Month
% Rank:
50
-50.40M
Peer Group Low
499.74M
Peer Group High
1 Year
% Rank:
28
58.31M
-154.12M
Peer Group Low
4.034B
Peer Group High
3 Months
% Rank:
44
-108.82M
Peer Group Low
1.445B
Peer Group High
3 Years
% Rank:
47
-112.21M
Peer Group Low
11.18B
Peer Group High
6 Months
% Rank:
38
-172.93M
Peer Group Low
2.251B
Peer Group High
5 Years
% Rank:
60
-30.01M
Peer Group Low
13.41B
Peer Group High
YTD
% Rank:
38
-162.88M
Peer Group Low
1.445B
Peer Group High
10 Years
% Rank:
67
980382.0
Peer Group Low
17.32B
Peer Group High
Date Unavailable
Risk
Performance Versus Peer Group
Annual Total Returns Versus Peers
As of May 24, 2026.
Asset Allocation
As of March 31, 2026.
| Type | % Net |
|---|---|
| Cash | 0.83% |
| Stock | 93.01% |
| Bond | 5.05% |
| Convertible | 0.00% |
| Preferred | 0.11% |
| Other | 1.00% |
Top 10 Holdings
| Name | % Weight | Price | % Change |
|---|---|---|---|
| Avantis US Equity Fund G | 18.54% | 23.68 | 0.42% |
| American Century Focused Dynamic Growth Fd G | 15.19% | 91.91 | 0.00% |
| American Century Focused Large Cap Value Fund G | 15.08% | 11.16 | 0.72% |
| Avantis International Equity Fund G | 13.23% | 17.08 | -0.12% |
| American Century Non-US Intrinsic Value Fd G | 4.80% | 10.79 | -0.64% |
| American Century Focused Internatl Growth Fd G | 4.71% | 19.88 | 0.20% |
| American Century Emerging Markets Fund G | 4.19% | 19.73 | 0.05% |
| American Century Mid Cap Value Fund G | 3.64% | 15.99 | 0.76% |
| American Century Heritage Fund G | 3.60% | 27.13 | 1.23% |
| American Century Global Real Estate Fund G | 2.81% | 14.75 | -0.20% |
Fees & Availability
| Fees | |
| Actual 12B-1 Fee | -- |
| Actual Management Fee | 0.58% |
| Administration Fee | -- |
| Maximum Front Load | -- |
| Maximum Deferred Load | -- |
| Maximum Redemption Fee | -- |
| General Availability | |
| Available for Insurance Product | -- |
| Available for RRSP | -- |
| Purchase Details | |
| Open to New Investors |
|
| Minimum Initial Investment | 2500.00 None |
| Minimum Subsequent Investment | 50.00 None |
Basic Info
| Investment Strategy | |
| The Fund seeks the highest total return consistent with its asset mix. It is a fund of funds which invests in American Century mutual funds that represent a variety of asset classes and investment styles. It assumes a retirement age of 65 and may not be appropriate for an investor who plans to retire at the target date. |
| General | |
| Security Type | Mutual Fund |
| Equity Style | -- |
| Broad Asset Class | Allocation |
| Broad Category | Allocation |
| Global Peer Group | Target Maturity MA USD 2060 |
| Peer Group | Mixed-Asset Target 2060 Funds |
| Global Macro | Target Maturity |
| US Macro | Mixed-Assets Target Date Funds |
| YCharts Categorization | -- |
| YCharts Benchmark | -- |
| Prospectus Objective | Growth Funds |
| Fund Owner Firm Name | American Century Investments |
| Broad Asset Class Benchmark Index | |
| ^SPXTR | 100.0% |
Fundamentals
| General | |
| Distribution Yield | -- |
| Dividend Yield TTM (5-21-26) | 2.10% |
| 30-Day SEC Yield (7-31-23) | 0.00% |
| 7-Day SEC Yield | -- |
| Number of Holdings | 22 |
| Stock | |
| Weighted Average PE Ratio | 29.41 |
| Weighted Average Price to Sales Ratio | 6.747 |
| Weighted Average Price to Book Ratio | 7.354 |
| Weighted Median ROE | 32.14% |
| Weighted Median ROA | 10.66% |
| ROI (TTM) | 15.65% |
| Return on Investment (TTM) | 15.65% |
| Earning Yield | 0.0461 |
| LT Debt / Shareholders Equity | 1.002 |
| Number of Equity Holdings | 0 |
| Bond | |
| Yield to Maturity (3-31-26) | 4.60% |
| Effective Duration | -- |
| Average Coupon | 4.81% |
| Calculated Average Quality | 3.238 |
| Effective Maturity | 9.839 |
| Nominal Maturity | 10.91 |
| Number of Bond Holdings | 0 |
As of March 31, 2026
Growth Metrics
| EPS Growth (1Y) | 27.28% |
| EPS Growth (3Y) | 15.28% |
| EPS Growth (5Y) | 20.20% |
| Sales Growth (1Y) | 13.75% |
| Sales Growth (3Y) | 12.78% |
| Sales Growth (5Y) | 14.45% |
| Sales per Share Growth (1Y) | 18.24% |
| Sales per Share Growth (3Y) | 12.67% |
| Operating Cash Flow - Growth Rate (3Y) | 20.15% |
As of March 31, 2026
Fund Details
Top Portfolio Holders
| Name | % Weight |
|---|---|
| Portfolio A | 5.00% |
| Portfolio B | 3.50% |
| Portfolio C | 2.25% |
Excel Add-In Codes
| Name: =YCI("M:AAEFX", "name") |
| Broad Asset Class: =YCI("M:AAEFX", "broad_asset_class") |
| Broad Category: =YCI("M:AAEFX", "broad_category_group") |
| Prospectus Objective: =YCI("M:AAEFX", "prospectus_objective") |
| To find the codes for any of our securities and financial metrics, see our Complete Excel Reference. |