

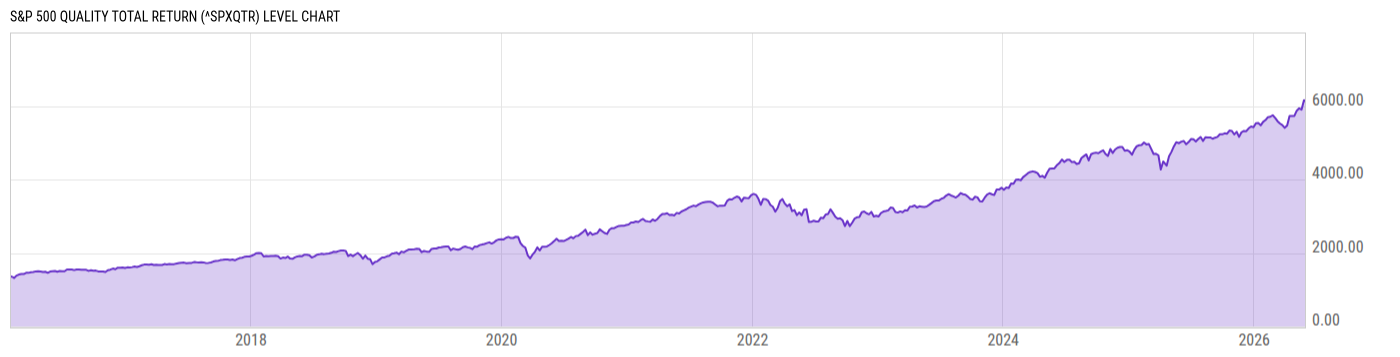
S&P 500 Quality Total Return (^SPXQTR)
6138.24
-6.37
(-0.10%)
USD |
May 29, 20:00
Level Chart
Key Stats
Basic Info
| The S&P 500 Quality Index is designed to track high quality stocks in the S&P 500 (^SPX) by quality score, which is calculated based on return on equity, accruals ratio, and financial leverage ratio. The index solely comprises constituents with high quality scores and is weighted by a product of the quality score and float-adjusted market cap. The index is rebalanced semiannually in June and December. | |
| Core Index Name | S&P 500 Quality |
| Return Type | Total Return |
| Currency Code | USD |
| Category Hedge Type | Not Hedged |
Index Varieties
| Return Types | |
| Net Total Return | S&P 500 Quality Net Total Return |
| Price Return | S&P 500 Quality |
Total Return Performance
As of May 29, 2026.
Returns for periods of 1 year and above are annualized.
Annual Performance
As of May 30, 2026.
Basic Info
| The S&P 500 Quality Index is designed to track high quality stocks in the S&P 500 (^SPX) by quality score, which is calculated based on return on equity, accruals ratio, and financial leverage ratio. The index solely comprises constituents with high quality scores and is weighted by a product of the quality score and float-adjusted market cap. The index is rebalanced semiannually in June and December. | |
| Core Index Name | S&P 500 Quality |
| Return Type | Total Return |
| Currency Code | USD |
| Category Hedge Type | Not Hedged |
Index Varieties
| Return Types | |
| Net Total Return | S&P 500 Quality Net Total Return |
| Price Return | S&P 500 Quality |