

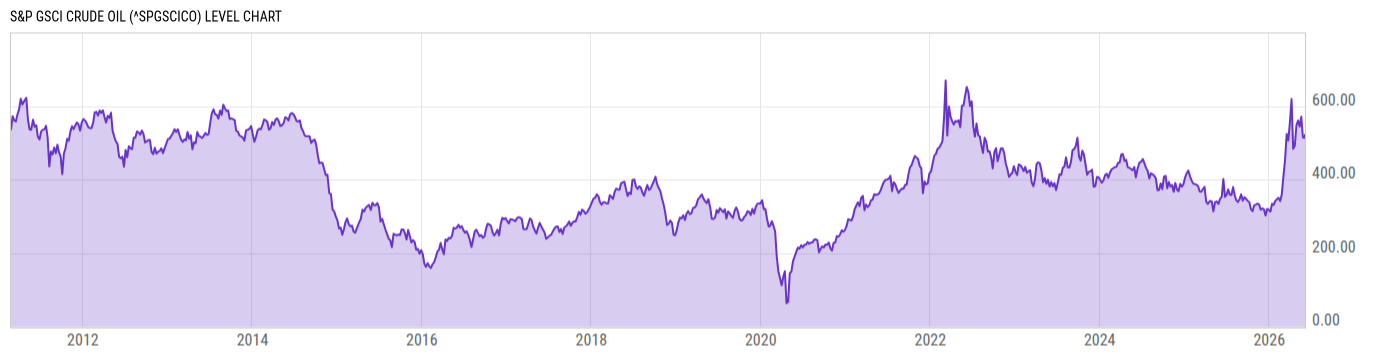
S&P GSCI Crude Oil (^SPGSCICO)
521.48
-4.77
(-0.91%)
USD |
Jun 04, 02:10
Level Chart
Key Stats
Basic Info
| N/A | |
| Core Index Name | S&P GSCI Crude Oil |
| Return Type | Price Return |
| Currency Code | USD |
| Category Hedge Type | Not Hedged |
Index Varieties
| Return Types | |
| Excess Return | S&P GSCI Crude Oil Excess Return |
| Total Return | S&P GSCI Crude Oil Total Return |
Total Return Performance
As of June 03, 2026.
Returns for periods of 1 year and above are annualized.
Annual Performance
As of June 04, 2026.
Basic Info
| N/A | |
| Core Index Name | S&P GSCI Crude Oil |
| Return Type | Price Return |
| Currency Code | USD |
| Category Hedge Type | Not Hedged |
Index Varieties
| Return Types | |
| Excess Return | S&P GSCI Crude Oil Excess Return |
| Total Return | S&P GSCI Crude Oil Total Return |