

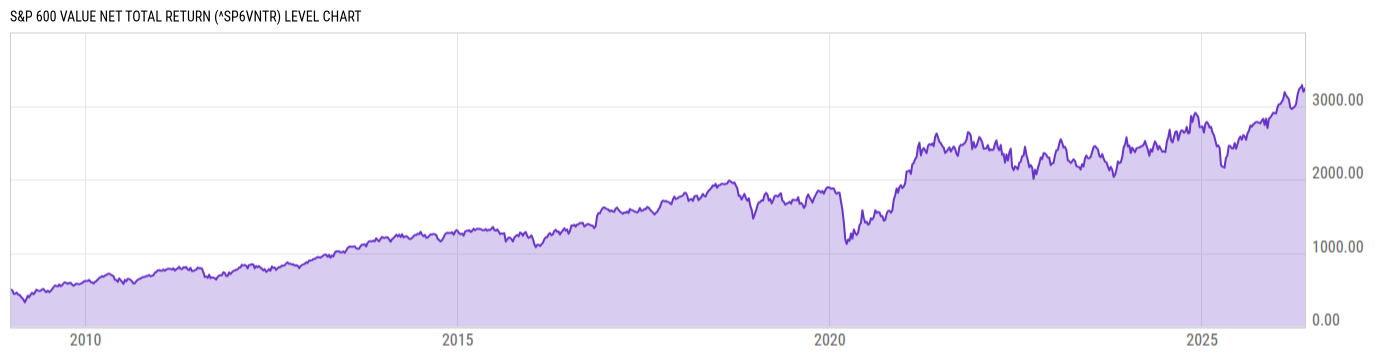
S&P 600 Value Net Total Return (^SP6VNTR)
3171.18
-44.80
(-1.39%)
USD |
May 15, 20:00
Level Chart
Key Stats
Basic Info
| The S&P Small-Cap 600 Value index tracks the performance of the small-cap value segment within the S&P 600 (^SML). Value is measured using the ratios of book value, earnings, and sales to price. | |
| Core Index Name | S&P 600 Value |
| Return Type | Net Total Return |
| Currency Code | USD |
| Category Hedge Type | Not Hedged |
Index Varieties
| Return Types | |
| Price Return | S&P 600 Value |
| Total Return | S&P 600 Value Total Return |
| Currencies | |
| EUR | S&P 600 Value Net Total Return EUR |
Total Return Performance
As of May 15, 2026.
Returns for periods of 1 year and above are annualized.
Annual Performance
As of May 18, 2026.
Basic Info
| The S&P Small-Cap 600 Value index tracks the performance of the small-cap value segment within the S&P 600 (^SML). Value is measured using the ratios of book value, earnings, and sales to price. | |
| Core Index Name | S&P 600 Value |
| Return Type | Net Total Return |
| Currency Code | USD |
| Category Hedge Type | Not Hedged |
Index Varieties
| Return Types | |
| Price Return | S&P 600 Value |
| Total Return | S&P 600 Value Total Return |
| Currencies | |
| EUR | S&P 600 Value Net Total Return EUR |